User Manual for k6, an Open Source Tool for Load Testing
What is k6? Who is it for? k6 is a popular open source tool for load testing built for engineering teams. Born as a startup, k6 was acquired by Grafana Labs in 2021, perhaps for its ability of integration with a really large number of third-party tools. In this article, we will lay out our experience of working with k6 and our opinion on how to make the best of using it.
Advantages of k6
Limitations of k6
Starting Load Testing with k6
In k6, the function that generates the load looks like this:
export default function() {
}
You can see it used in a simple script below:
import http from ‘k6/http’;
import { sleep } from ‘k6’;
export default function () {
http.get(‘https://test.k6.io’);
sleep(1);
}
And this is how you launch k6:
k6 run script.js
Now let’s add virtual users (VUs) and set the duration of the test:
k6 run --vus 10 --duration 30s script.js
You can do this in the script itself:
stages: [
{ duration: ‘2m’, target: 1000},
{ duration: ’30m’, target: 1000},
{ duration: ’30s’, target: 1500},
{ duration: ’30m’, target: 1500}
],
Or use this code:
export let options = {
vus: 10,
duration: ’30s’,
};
What Are k6 Virtual Users in Load Tests?
k6 works with the concept of virtual users (VUs) that run scripts – they are essentially parallel while (true) loops. The scripts are written using JavaScript in the form of ES6 modules (specification for JS), which allows you to split large tests into smaller parts or create reusable parts.
Scripts should contain at least a default function – this defines the entry point for your VUs.
export default function () {
// vu code: do things here…
}
The code inside the default function is called “VU code” and is repeated over and over while the test is running. The code outside of it is called the “initialization code” and is run only once for each VU.
The VU code can execute HTTP requests, generate metrics, and generally do everything you would expect from a load test – with a few important exceptions: you cannot upload anything from your local file system or import any other modules. All this needs to be done from the initialization code.
You can use options.stages to change the number of VUs during the load test.
import http from ‘k6/http’;
import { check, sleep } from ‘k6’;
export const options = {
stages: [
{ duration: ’30s’, target: 20 },
{ duration: ‘1m30s’, target: 10 },
{ duration: ’20s’, target: 0 },
],
};
export default function () {
const res = http.get(‘https://httpbin.org/’);
check(res, { ‘status was 200’: (r) => r.status == 200 });
sleep(1);
}
This can also be accomplished with more advanced configuration using scenarios and the ramping-vus executor.
What Are Test Scenarios in k6?
Scenarios provide opportunities for finer tuning of VUs and iterations. Multiple scenarios can work in one script, and each of them can independently perform different JavaScript functions. Each scenario can use its own number of VUs and iteration patterns. Scenarios can be configured to run sequentially or simultaneously.
export const options = {
scenarios: {
example_scenario: {
// name of the executor to use
executor: ‘shared-iterations’,
// common scenario configuration
startTime: ’10s’,
gracefulStop: ‘5s’,
env: { EXAMPLEVAR: ‘testing’ },
tags: { example_tag: ‘testing’ },
// executor-specific configuration
vus: 10,
iterations: 200,
maxDuration: ’10s’,
},
another_scenario: {
/*…*/
},
},
};
Types of Executors in k6
Executors are the workhorses of the k6 execution engine. Each one schedules VUs and iterations differently, and you’ll choose one depending on the type of traffic you want to model to test your services.
Types of executors in k6 are, as follows:
Name | Value | Description |
|---|---|---|
Shared iterations | shared-iterations | A fixed number of iterations are “distributed” between several VUs. |
Per VU iterations | per-vu-iterations | Each VU executes an exact number of iterations. |
Constant VUs | constant-vus | A fixed number of VUs execute the maximum possible number of iterations within a specified time interval. |
Ramping VUs | ramping-vus | A variable number of VUs execute the maximum number of iterations within a given time interval. |
Constant Arrival Rate | constant-arrival-rate | A fixed number of iterations are executed over a specified time period. |
Ramping Arrival Rate | ramping-arrival-rate | A variable number of iterations are executed over a specified time period. |
Externally Controlled | externally-controlled | Run-time management and scaling using k6’s REST API or Command Line Interface (CLI). |
There is also a number of common options to use with executors:
Option | Type | Description | default |
|---|---|---|---|
executor(required) | string | The name of the executor from the list of possible values. | – |
startTime | string | The countdown from the start of the load test, after which the scenario should start execution. | “0s” |
gracefulStop | string | The time to wait for iterations to complete executing before they are forcefully stopped. | “30s” |
exec | string | Name of the exported JS function to execute. | “default” |
env | object | Environment variables specific to this scenario. | {} |
tags | object | Tags specific to this scenario. | {} |
Shared iterations
A fixed number of iterations is “distributed” among a number of VUs, and the test ends after all iterations are completed. Iterations are distributed unevenly, and some VUs will perform more iterations than others.
Option | Type | Description | default |
|---|---|---|---|
vus | integer | Number of VUs to run concurrently. | 1 |
iterations | integer | Total number of scenario iterations executed by all VUs. | 1 |
maxDuration | string | The maximum duration of the scenario until it is forced to stop (excluding gracefulStop). | “10m” |
Use Shared iterations if you want a certain number of VUs to perform a fixed total number of iterations, and the number of iterations performed by one VU does not matter.
In the following example, we will perform 200 total iterations, distributed among 10 VUs, with a maximum duration of 10 seconds:
import http from ‘k6/http’;
export const options = {
discardResponseBodies: true,
scenarios: {
contacts: {
executor: ‘shared-iterations’,
vus: 10,
iterations: 200,
maxDuration: ’10s’,
},
},
};
export default function () {
http.get(‘https://test.k6.io/contacts.php’);
}
Per VU iterations
Each VU performs an exact number of iterations. The total number of iterations performed will be equal to vus*iterations.
Option | Type | Description | default |
|---|---|---|---|
vus | integer | Number of VUs to run simultaneously | 1 |
iterations | integer | The number of iterations performed by each VU. | 1 |
maxDuration | string | The maximum duration of the scenario until it is forced to stop (excluding gracefulStop). | “10m” |
Use this executor If you need a certain number of VUs to perform a certain number of iterations. This can be useful when you have fixed sets of test data that you want to split between VUs.
In the following example, 10 VUs perform 20 iterations each, a total of 200 iterations with a maximum duration of 1 hour and 30 minutes:
import http from ‘k6/http’;
export const options = {
discardResponseBodies: true,
scenarios: {
contacts: {
executor: ‘per-vu-iterations’,
vus: 10,
iterations: 20,
maxDuration: ‘1h30m’,
},
},
};
export default function () {
http.get(‘https://test.k6.io/contacts.php’);
}
Constant VUs
A fixed number of VUs performs the maximum possible number of iterations within a specified time interval.
Option | Type | Description | default |
|---|---|---|---|
duration(required) | string | The total duration of the scenario (excluding gracefulStop). | – |
vus | integer | Number of VUs to run concurrently. | 1 |
Use this executor if you need a certain number of VUs to work for a certain time.
In this example, 10 VUs will work continuously for 45 minutes:
import http from ‘k6/http’;
import { sleep } from ‘k6’;
export const options = {
discardResponseBodies: true,
scenarios: {
my_awesome_api_test: {
executor: ‘constant-vus’,
vus: 10,
duration: ’45m’,
},
},
};
export default function () {
http.get(‘https://test-api.k6.io/’);
sleep(Math.random() * 3);
}
Ramping VUs
A variable number of VUs performs the maximum number of iterations within a given time interval.
Option | Type | Description | default |
|---|---|---|---|
stages(required) | array | An array of objects defining the target number of VUs to be increased or decreased to. | [ ] |
startVUs | integer | The number of VUs to run at the test start. | 1 |
gracefulRampDown | string | The time to wait for the completion of an already started iteration before stopping it during a ramp down. | “30s” |
Use this executor if you need to increase or decrease the number of VUs for certain periods of time.
In this example, we will run a two-step test with an increase from 0 to 100 VUs in 5 seconds and back to 0 VUs in 5 seconds:
import http from ‘k6/http’;
export const options = {
discardResponseBodies: true,
scenarios: {
contacts: {
executor: ‘ramping-vus’,
startVUs: 0,
stages: [
{ duration: ‘5s’, target: 100 },
{ duration: ‘5s’, target: 0 },
],
gracefulRampDown: ‘0s’,
},
},
};
export default function () {
http.get(‘https://test.k6.io/contacts.php’);
}
Constant arrival rate
A fixed number of iterations are executed over a certain period of time. Since the iteration execution time can vary, for example, due to the system slowing down under the test, this executor will try to compensate for this by running additional VUs, including potentially initializing more in the middle of the test, to maintain a configured iteration rate.
Option | Type | Description | default |
|---|---|---|---|
duration(required) | string | Total duration of the scenario (excluding gracefulStop) | – |
rate(required) | integer | The number of iterations to execute for each specified period (TimeUnit) | – |
preAllocatedVUs(required) | integer | The number of VUs that must be pre-allocated before starting the test | – |
timeUnit | string | Time period to apply the rate value | “1s” |
maxVUs | integer | Maximum number of VUs to allow during the test | – |
Use this executor to maintain a constant number of requests without affecting the performance of the system under test.
In this example, we will maintain a constant intensity of 200 requests per second for 1 minute, which will allow k6 to dynamically schedule up to 100 VUs:
import http from ‘k6/http’;
export const options = {
discardResponseBodies: true,
scenarios: {
contacts: {
executor: ‘constant-arrival-rate’,
rate: 200, // 200 RPS, since timeUnit is the default 1s
duration: ‘1m’,
preAllocatedVUs: 50,
maxVUs: 100,
},
},
};
export default function () {
http.get(‘https://test.k6.io/contacts.php’);
}
Ramping arrival rate
A variable number of iterations is performed over a certain period of time. k6 will try to dynamically change the number of VUs to achieve a given iteration frequency.
Option | Type | Description | default |
|---|---|---|---|
stages(required) | array | An array of objects indicating the target number of iterations to increase or decrease. | [ ] |
preAllocatedVUs(required) | integer | The number of VUs that must be pre-allocated before starting the test. | – |
startRate | integer | The number of iterations performed for each specified period (TimeUnit) | 0 |
timeUnit | string | Period of time to apply the startRate and the stages target value. | “1s” |
maxVUs | integer | Maximum number of VUs to allow during the test run | – |
Use this executor, if it is necessary that the tests are not affected by the performance of the system under test, and you want to increase or decrease the number of iterations over certain periods of time
In this example, we will run a test with a variable number of requests per second, starting from 50, increasing to 200, and then back to 0 in 1 minute:
import http from ‘k6/http’;
export const options = {
discardResponseBodies: true,
scenarios: {
contacts: {
executor: ‘ramping-arrival-rate’,
startRate: 50,
timeUnit: ‘1s’,
preAllocatedVUs: 50,
maxVUs: 100,
stages: [
{ target: 200, duration: ’30s’ },
{ target: 0, duration: ’30s’ },
],
},
},
};
export default function () {
http.get(‘https://test.k6.io/contacts.php’);
}
Externally controlled
Control and scaling during the test via the k6 REST API or the command line interface.
Option | Type | Description | default |
|---|---|---|---|
duration(required) | string | The total duration of the test. | – |
vus | integer | Number of VUs to run concurrently. | – |
maxVUs | integer | Maximum number of VUs to allow during the test | – |
Use this executor, if you want to control the number of VUs during the test execution. This is the only performer that is not supported in the k6 cloud, it can only be used locally with the launch of k6 (k6 Cloud is a subscription based service, see our article “Features of Testing Cloud Services”).
In this example, we will run a run-time controlled test starting from 10 VUs to a maximum of 50 and with a total duration of 10 minutes:
import http from ‘k6/http’;
export const options = {
discardResponseBodies: true,
scenarios: {
contacts: {
executor: ‘externally-controlled’,
vus: 10,
maxVUs: 50,
duration: ’10m’,
},
},
};
export default function () {
http.get(‘https://test.k6.io/contacts.php’);
}
GracefulStop
GracefulStop option is available for all types of executors, except Externally controlled, and allows the user to specify the duration of the wait before the forced interruption. The default value is 30 seconds.
Note that even though the total duration of the test in the example is 10 seconds, the actual execution time was 13 seconds due to gracefulStop, which gave VU an additional 3 seconds to complete the iterations being performed. 23 of the current iterations were not completed and were interrupted.
A similar option exists for the ramping-vus executor, and it is gracefulRampDown. It defines the time during which k6 must wait for any current iterations to complete before the VUs are returned to the pool during the deceleration period defined in stages.
import http from ‘k6/http’;
export const options = {
discardResponseBodies: true,
scenarios: {
contacts: {
executor: ‘constant-vus’,
vus: 100,
duration: ’10s’,
gracefulStop: ‘3s’,
},
},
};
export default function () {
const delay = Math.floor(Math.random() * 5) + 1;
http.get(`https://httpbin.test.k6.io/delay/${delay}`);
}
Running this script would result in something like:
running (13.0s), 000/100 VUs, 349 complete and 23 interrupted iterations
contacts ✓ [======================================] 100 VUs 10s
Metrics in k6
Built-in metrics
Metric name | Type | Description |
|---|---|---|
vus | Gauge | Current number of active virtual users |
vus_max | Gauge | The maximum possible number of VUs in the test (resources for VUs are allocated in advance to ensure that performance does not suffer when the load level increases) |
iterations | Counter | Iteration counter. The number of times that VUs executed the script in the test (default function). |
iteration_duration | Trend | The time required to perform one complete iteration of the function. |
dropped_iterations | Counter | The number of iterations that could not be started due to lack of VUs (arrival-rate executors) or lack of time (due to expired maxDuration in iteration-based executors). |
data_received | Counter | The amount of data received |
data_sent | Counter | The amount of data sent |
checks | Rate | Number of successful checks |
http_reqs | Counter | How many total HTTP requests were generated by k6. |
http_req_blocked | Trend | The time spent on blocking (waiting for a free TCP connection slot) before initiating the request. float |
http_req_connecting | Trend | The time taken to establish a TCP connection with a remote host. float |
http_req_tls_handshaking | Trend | Time spent negotiating a TLS session with a remote host |
http_req_sending | Trend | The time taken to send data to the remote host. float |
http_req_waiting | Trend | The time spent waiting for a response from the remote host (“time to first byte”, or “TTFB”). float |
http_req_receiving | Trend | The time taken to receive response data from the remote host. float |
http_req_duration | Trend | Total request time. It is equal tohttp_re_sending +http_ru_waiting + http_ru_receiving (i.e. how long it took the remote server to process the request and respond without the initial DNS lookup/connection time). float |
http_req_failed (≥ v0.31) | Rate | The number of failed requests according to setResponseCallback. |
To make it clear, setResponseCallback is a function that must be executed after another function has completed execution (hence the name). You can use the setResponseCallback function to determine whether the response was successful or failed.
Types of metrics
Counter and Gauge that have a value of zero (0) at the end of the test are an exception: they will NOT be output to the stdout summary.
You can get information about a particular request with the Response.timings object:
metric Type | Description |
|---|---|
Counter. Summarizes the values. | |
A metric that stores the minimum, maximum, and last values added to it. | |
A metric that shows the percentage of values other than zero. | |
A metric that allows you to calculate statistics of added values (minimum, maximum, average and percentiles). |
import http from ‘k6/http’;
export default function () {
const res = http.get(‘http://httpbin.org’);
console.log(‘Response time was ‘ + String(res.timings.duration) + ‘ ms’);
}
Custom metrics
You can also create your own metrics that will be displayed at the end of the load test.
In the example below, a Trend-type metric called “wait_time” will be created, which will be referenced in the code by myTrend variable.
import http from ‘k6/http’;
import { Trend } from ‘k6/metrics’;
const myTrend = new Trend(‘waiting_time’);
export default function () {
const r = http.get(‘https://httpbin.org’);
myTrend.add(r.timings.waiting);
console.log(myTrend.name); // waiting_time
}
Reporting Results in k6
Default results report in k6
By default, at the end of each load test, k6 prints a summary report with an overview of the test results to the standard output. It includes aggregated values for all built-in and configurable metrics and settings, thresholds, groups, and checks. If this is not enough, k6 also supports transmitting metrics to one or more external tools, such as InfluxDB, Kafka, StatsD, etc. The raw results can also be sent to a cloud service and exported as a CSV or JSON file for later processing.
Starting from k6 v0.30.0, you can fully customize the output and redirect it to a file.
The no-summary indicator disables the reports. handleSummary () callback allows you to fully customize the summary at the end of the test and export the summary report data in any desired format, such as JSON, CSV, XML (JUnit / xUnit, etc.), HTML, TXT, etc.
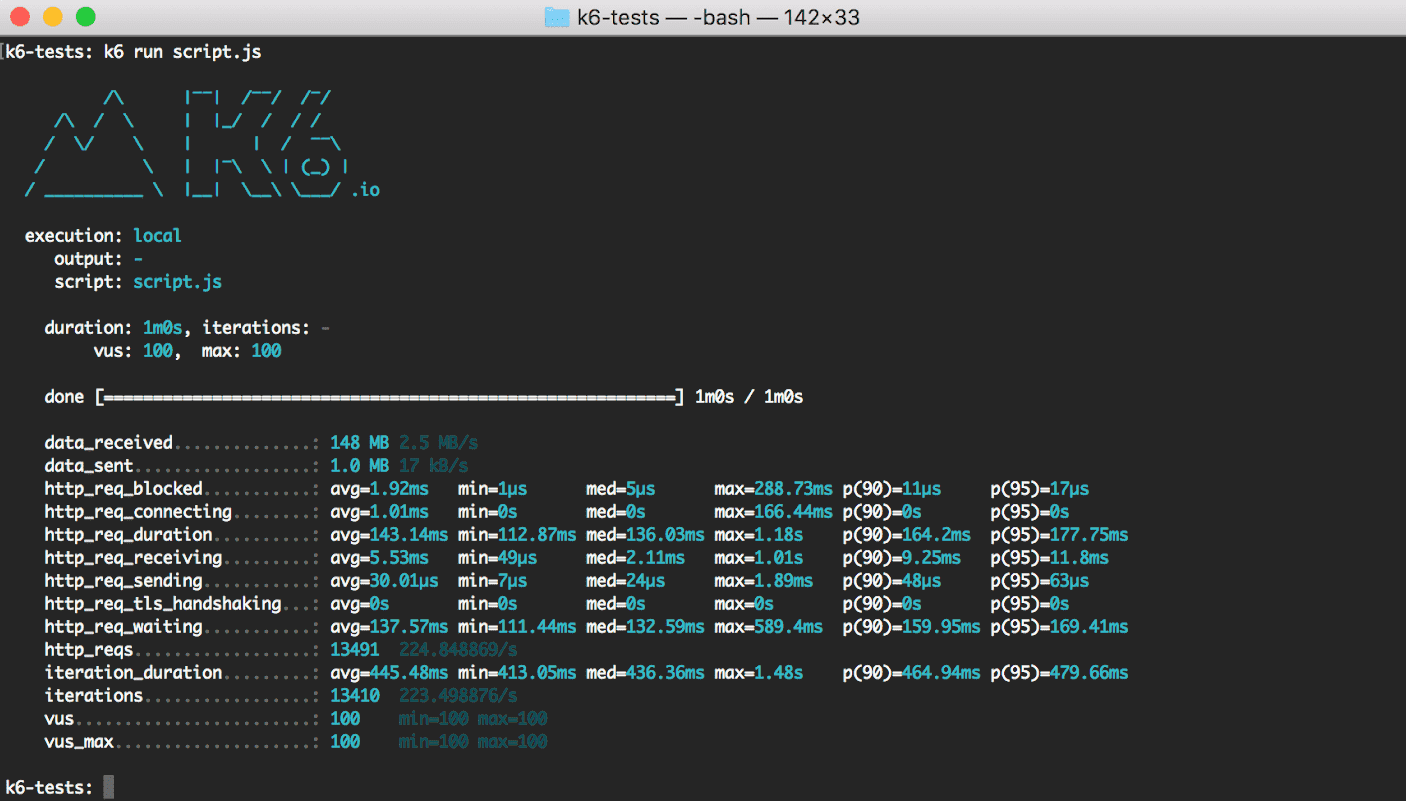
Standard output includes min., med., max, and percentiles for a number of values. On stdout they are printed like this:
http_req_duration……….: avg=143.14ms min=112.87ms med=136.03ms max=1.18s p(90)=164.2ms p(95)=177.75ms
You can use the summaryTrendStats option to change the statistics output. You can also configure the display of the time value with a fixed unit of time (seconds, milliseconds or microseconds) using the summaryTimeUnit option:
k6 run –summary-trend-stats=”min,avg,med,p(99),p(99.9),max,count” –summary-time-unit=ms script.js
Exporting load test summary to other platforms in k6
If the standard output at the end of your test is not enough, you can integrate and visualize k6 metrics on other platforms. Use the –out flag to send the results to an external output.
k6 run –out statsd script.js
You can also send metrics to multiple outputs simultaneously by using the –out flag multiple times:
k6 run \
–out json=test.json \
–out influxdb=http://localhost:8086/k6
The available built-in outputs currently include Amazon CloudWatch, Apache Kafka, Cloud, CSV, Datadog, Grafana Cloud / Prometheus, InfluxDB, JSON, Netdata, New Relic, Prometheus, StatsD.
handleSummary() callback
In k6 v0.30.0, there is handleSummary(), a new way to export summary data in JSON format, as well as in many other formats, such as CSV, XML, HTML, TXT, etc. We recommend using handleSummary() instead of an older function, –summary-export.
You can fully customize the final report using the handleSummary() function. k6 will call it at the end of the test. In addition to configuring the summary at the end of the test, you can convert the data into various formats and save them to files, or send generated reports to a remote server.
Checks
The checks do not stop the test execution. Instead, they save the result of the check (true/false) and allow you to continue executing the script. You can see an example of multiple checks below.
import { check } from ‘k6’;
import http from ‘k6/http’;
export default function () {
const res = http.get(‘http://test.k6.io/’);
check(res, {
‘is status 200’: (r) => r.status === 200,
‘body size is 11,105 bytes’: (r) => r.body.length == 11105,
});
}
Thresholds
Thresholds are a pass/fail criteria used to specify the performance expectations of the system under test. Thresholds analyze performance metrics and determine the final test result (pass/fail). Some of the examples may include:
The following example contains a scenario that defines two thresholds: error rate (http_read_failed metric) and 95 percentile response durations (http_req_duration metric).
import http from ‘k6/http’;
export const options = {
thresholds: {
http_req_failed: [‘rate<0.01’], // http errors should be less than 1%
http_req_duration: [‘p(95)<200’], // 95% of requests should be below 200ms
},
};
export default function () {
http.get(‘https://test-api.k6.io/public/crocodiles/1/’);
}
If any threshold value is exceeded, a small green check mark next to the metric name will become a red cross, and k6 will generate a non-zero exit code.
✓ http_req_duration…………..: avg=151.06ms min=151.06ms med=151.06ms max=151.06ms p(90)=151.06ms p(95)=151.06ms

{ expected_response:true }…: avg=151.06ms min=151.06ms med=151.06ms max=151.06ms p(90)=151.06ms p(95)=151.06ms

✓ http_req_failed…………….: 0.00% ✓ 0 ✗ 1
Groups
Groups are used to organize the scenario according to common logic. Groups can be nested. For each group() function, k6 generates a group_duration metric that contains the total execution time of the group function. When a tagged resource (checks, queries, or custom metrics) is executed in a group, k6 sets a tag group with the current group name.
import { group } from ‘k6’;
export default function () {
group(‘visit product listing page’, function () {
// …
});
group(‘add several products to the shopping cart’, function () {
// …
});
group(‘visit login page’, function () {
// …
});
group(‘authenticate’, function () {
// …
});
group(‘checkout process’, function () {
// …
});
}
Tags in k6
Tags are a simple and effective way to categorize k6 objects for subsequent filtering of results.
k6 provides two types of tags: user-defined tags, the ones you added when writing the script, and system tags, automatically assigned by k6.
System tags in k6
The list of automatically created tags includes these:
tag | Description |
|---|---|
proto | the protocol used (for example, HTTP/1.1) |
subproto | the subprotocol (used by web sockets) |
status | the HTTP status code (for example, 200, 404, etc.) |
method | the HTTP method name (e.g. GET, POST, etc.) or the RPC method for gRPC |
url | URL of the HTTP request |
name | HTTP request name |
group | the full group path |
check | the Check name |
error | a string with an error message other than HTTP (for example, a network or DNS error) |
error_code | a number that is unique for different error types |
tls_version | the TLS version |
scenario | the name of the scenario in which the metric was emitted |
service | name of the RPC service for gRPC |
Custom tags
Custom tags allow you to classify k6 objects. You can tag the following objects: checks, thresholds, and queries.
import http from ‘k6/http’;
import { Trend } from ‘k6/metrics’;
import { check } from ‘k6’;
const myTrend = new Trend(‘my_trend’);
export default function () {
// Add tag to request metric data
const res = http.get(‘http://httpbin.org/’, {
tags: {
my_tag: “I’m a tag”,
},
});
// Add tag to check
check(res, { ‘status is 200’: (r) => r.status === 200 }, { my_tag: “I’m a tag” });
// Add tag to custom metric
myTrend.add(res.timings.connecting, { my_tag: “I’m a tag” });
}
How to Record a Script in k6?
To test a website or web application, you can record a user session in the browser. To do this, use
k6 Browser Recorder, available in Chrome Webstore.
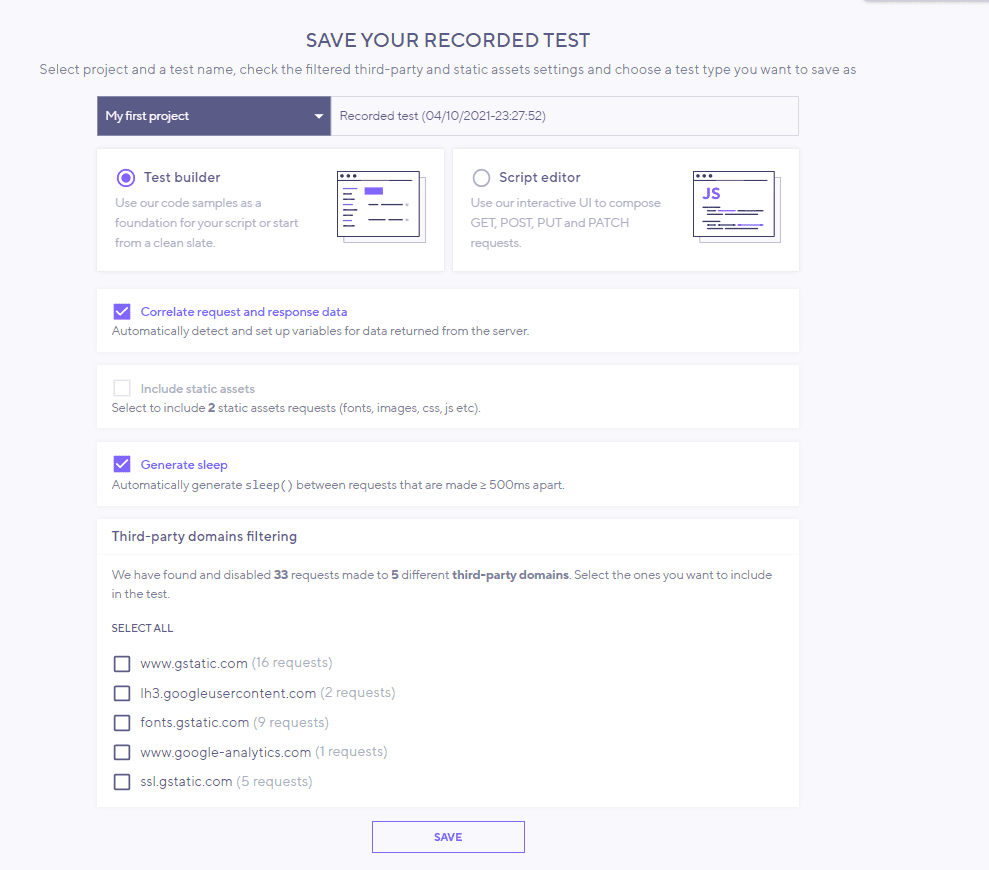
Open the recorder by clicking the “k6 Browser Recorder” icon in the upper right corner of the browser window, click “Start Recording” and start recording in the current browser tab.
To stop the recording, click “Stop”. You will be taken to the k6 Browser Recorder application page to view the test scenario. You will need to create a user account. The test script that you get as a result of recording a browser session is JavaScript. You can edit this script in the script editor in the app. This allows you to create more complex test scenarios if necessary. For example, you can use parameterized login data.
Dynamic Control of the Test Using the Built-in Commands in k6
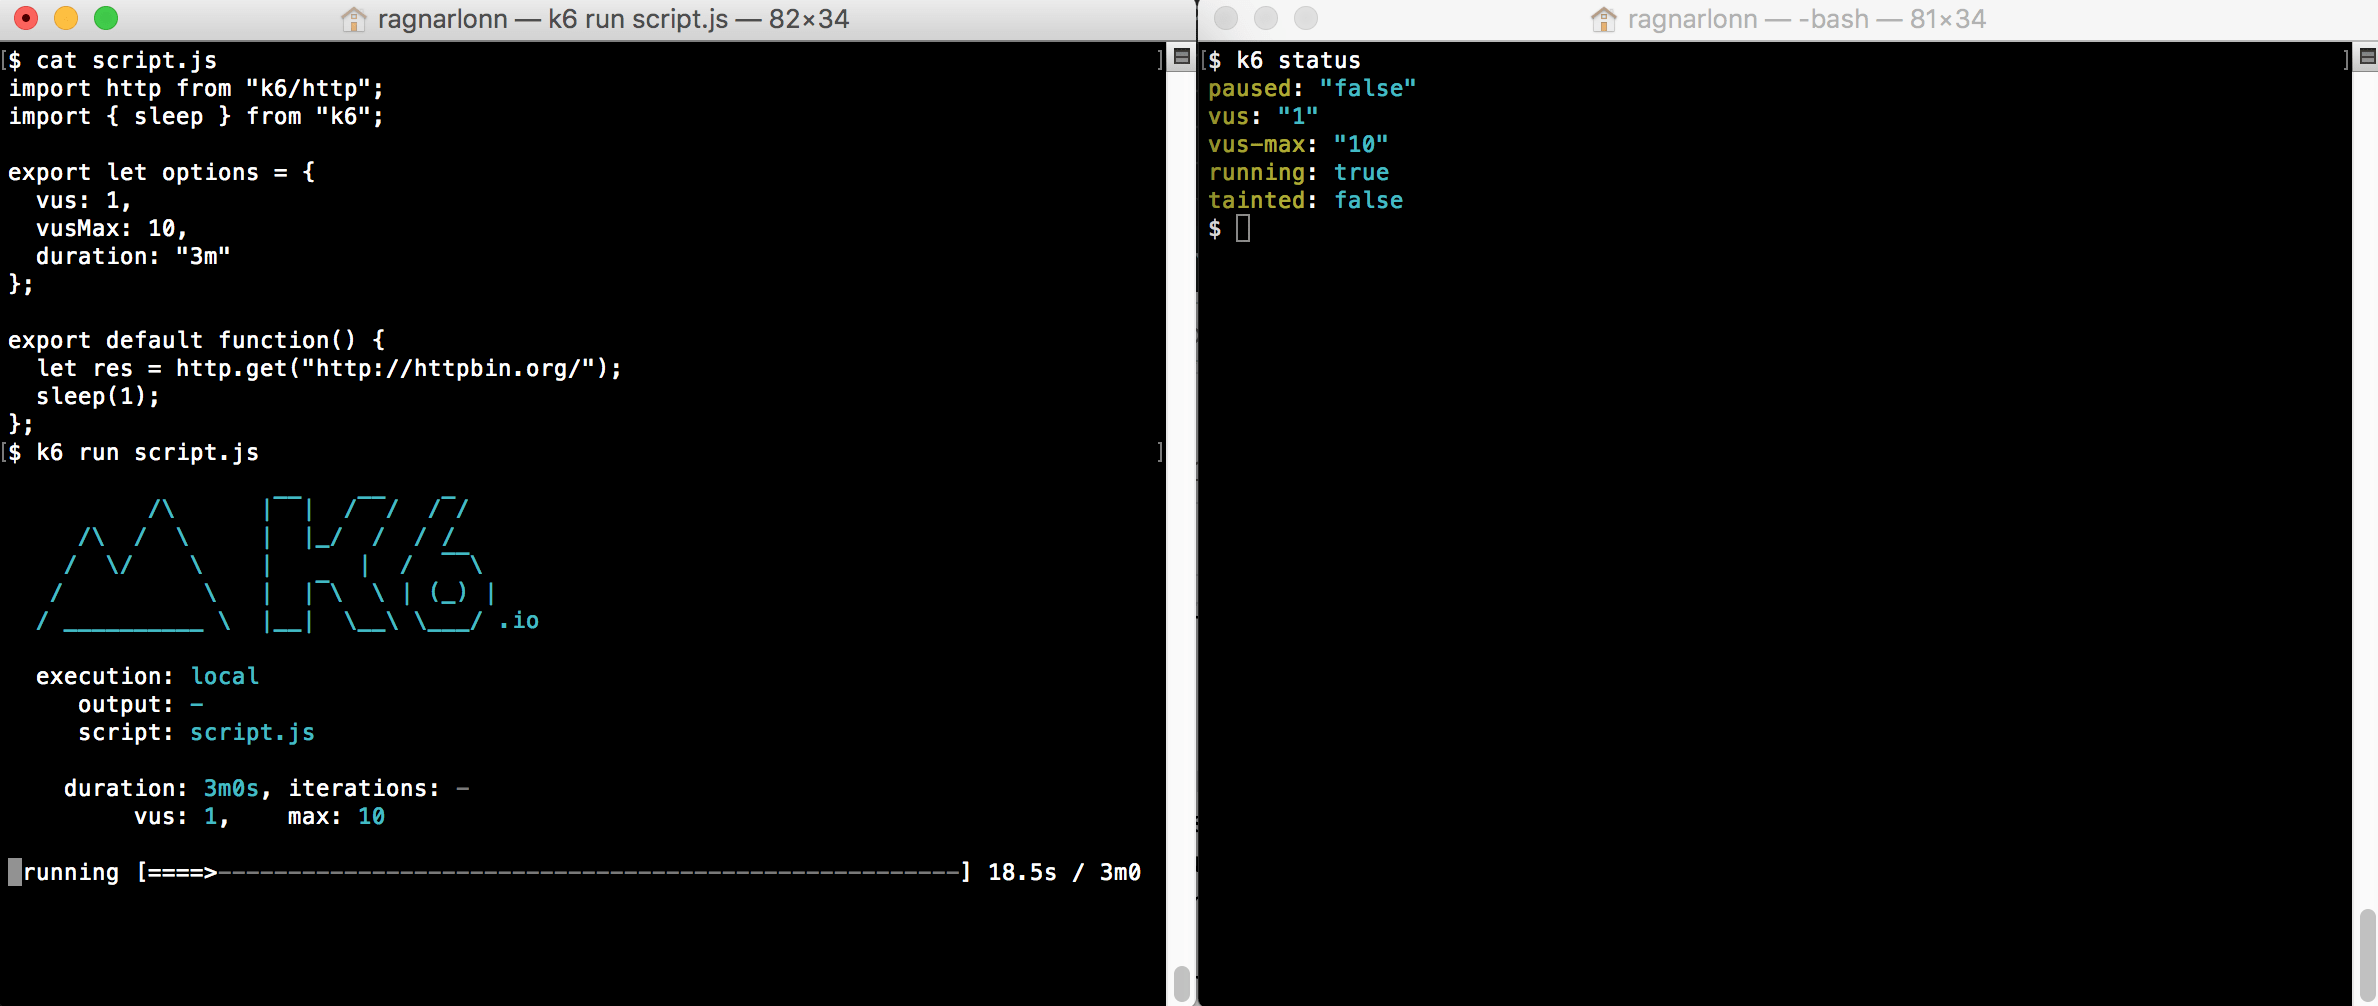
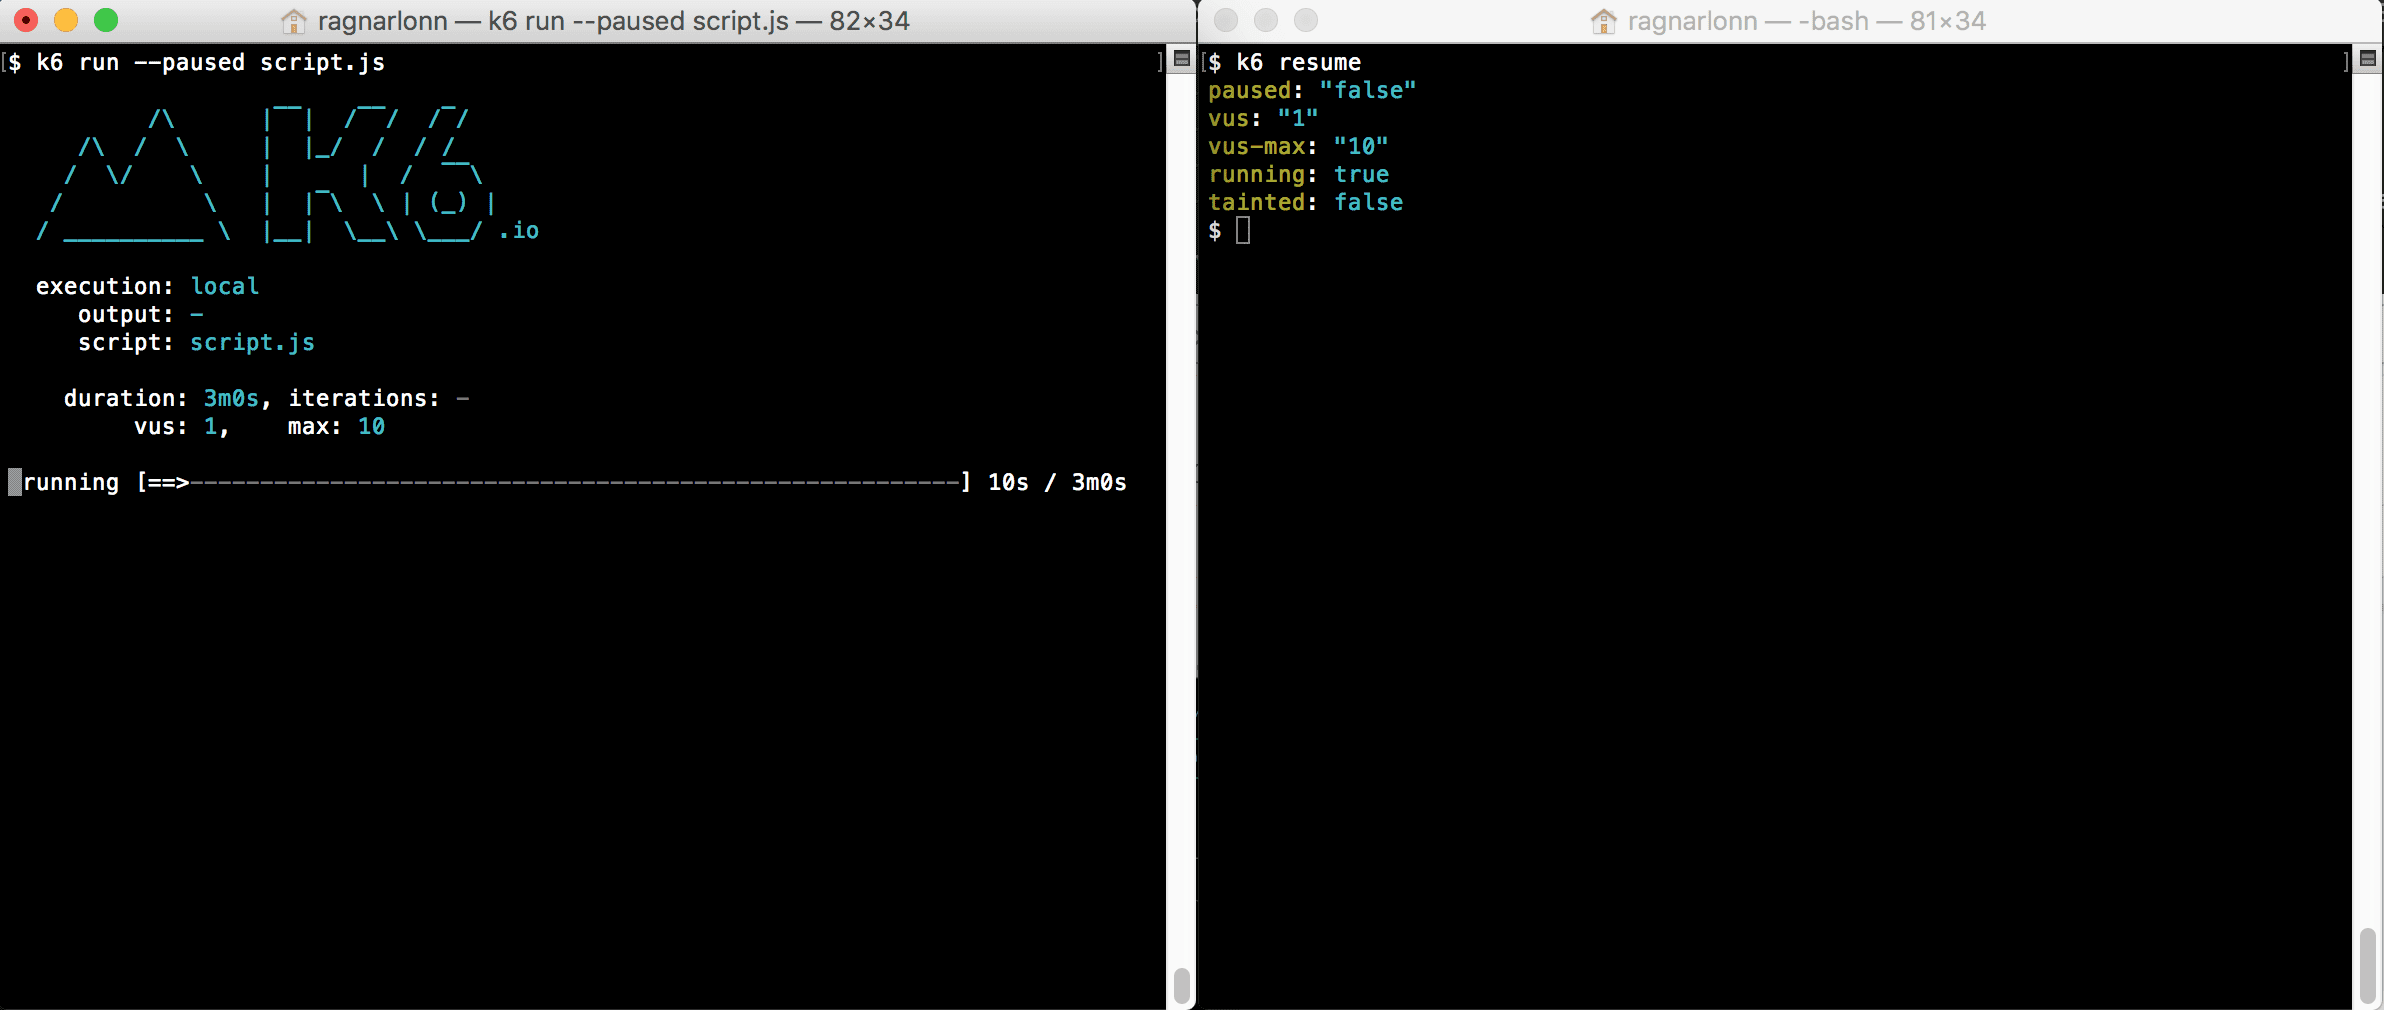
The built-in k6 commands “pause”, “resume”, “scale”, “stats” and “status” can be used to control the behavior of a running test. Basically, what you do is start a k6 test in one terminal window and then from another terminal window (or of course it could be programmatic execution – a batch job or whatnot) you issue k6 commands to control the running test. Here are some examples:
Status:
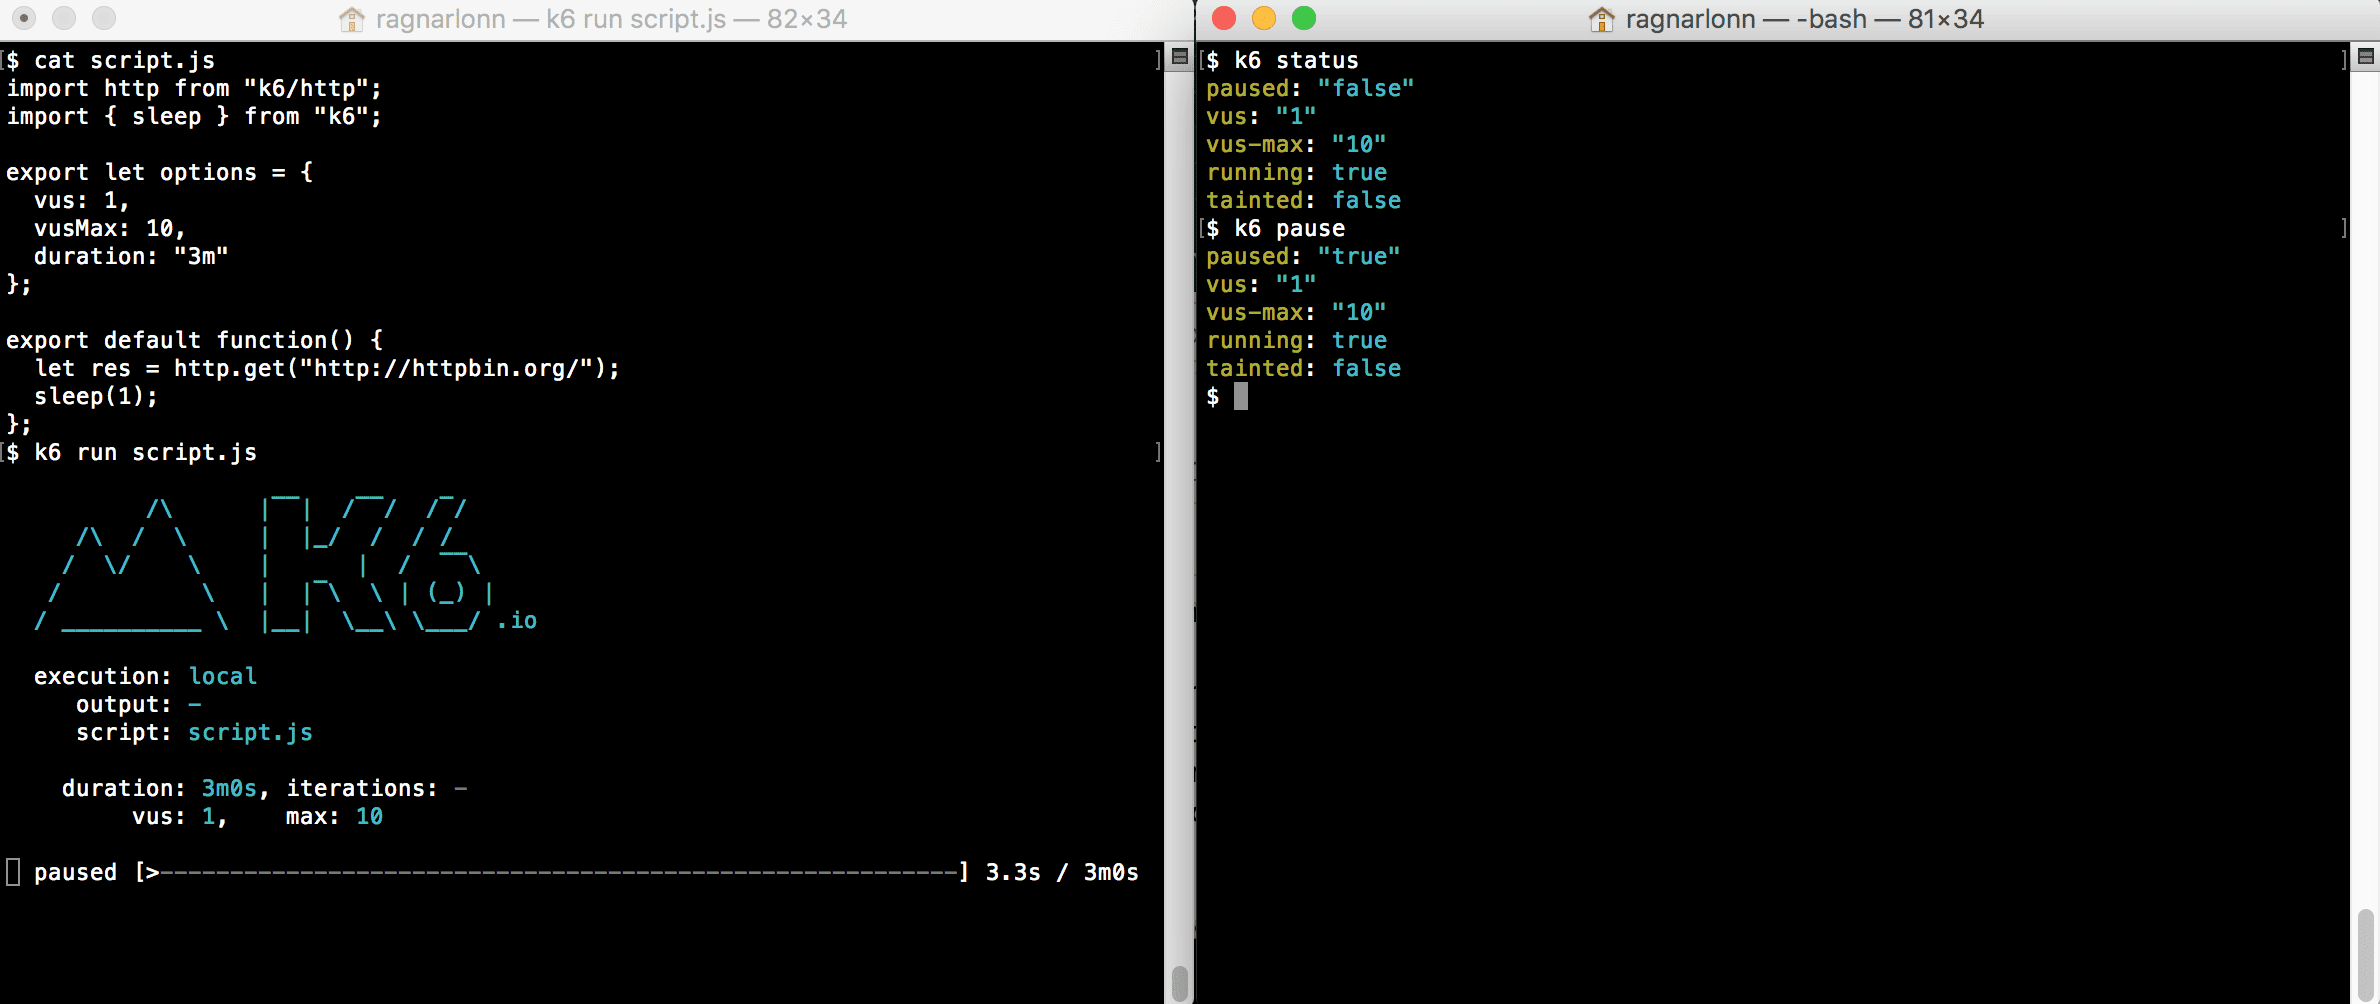
Pause:
Resume:
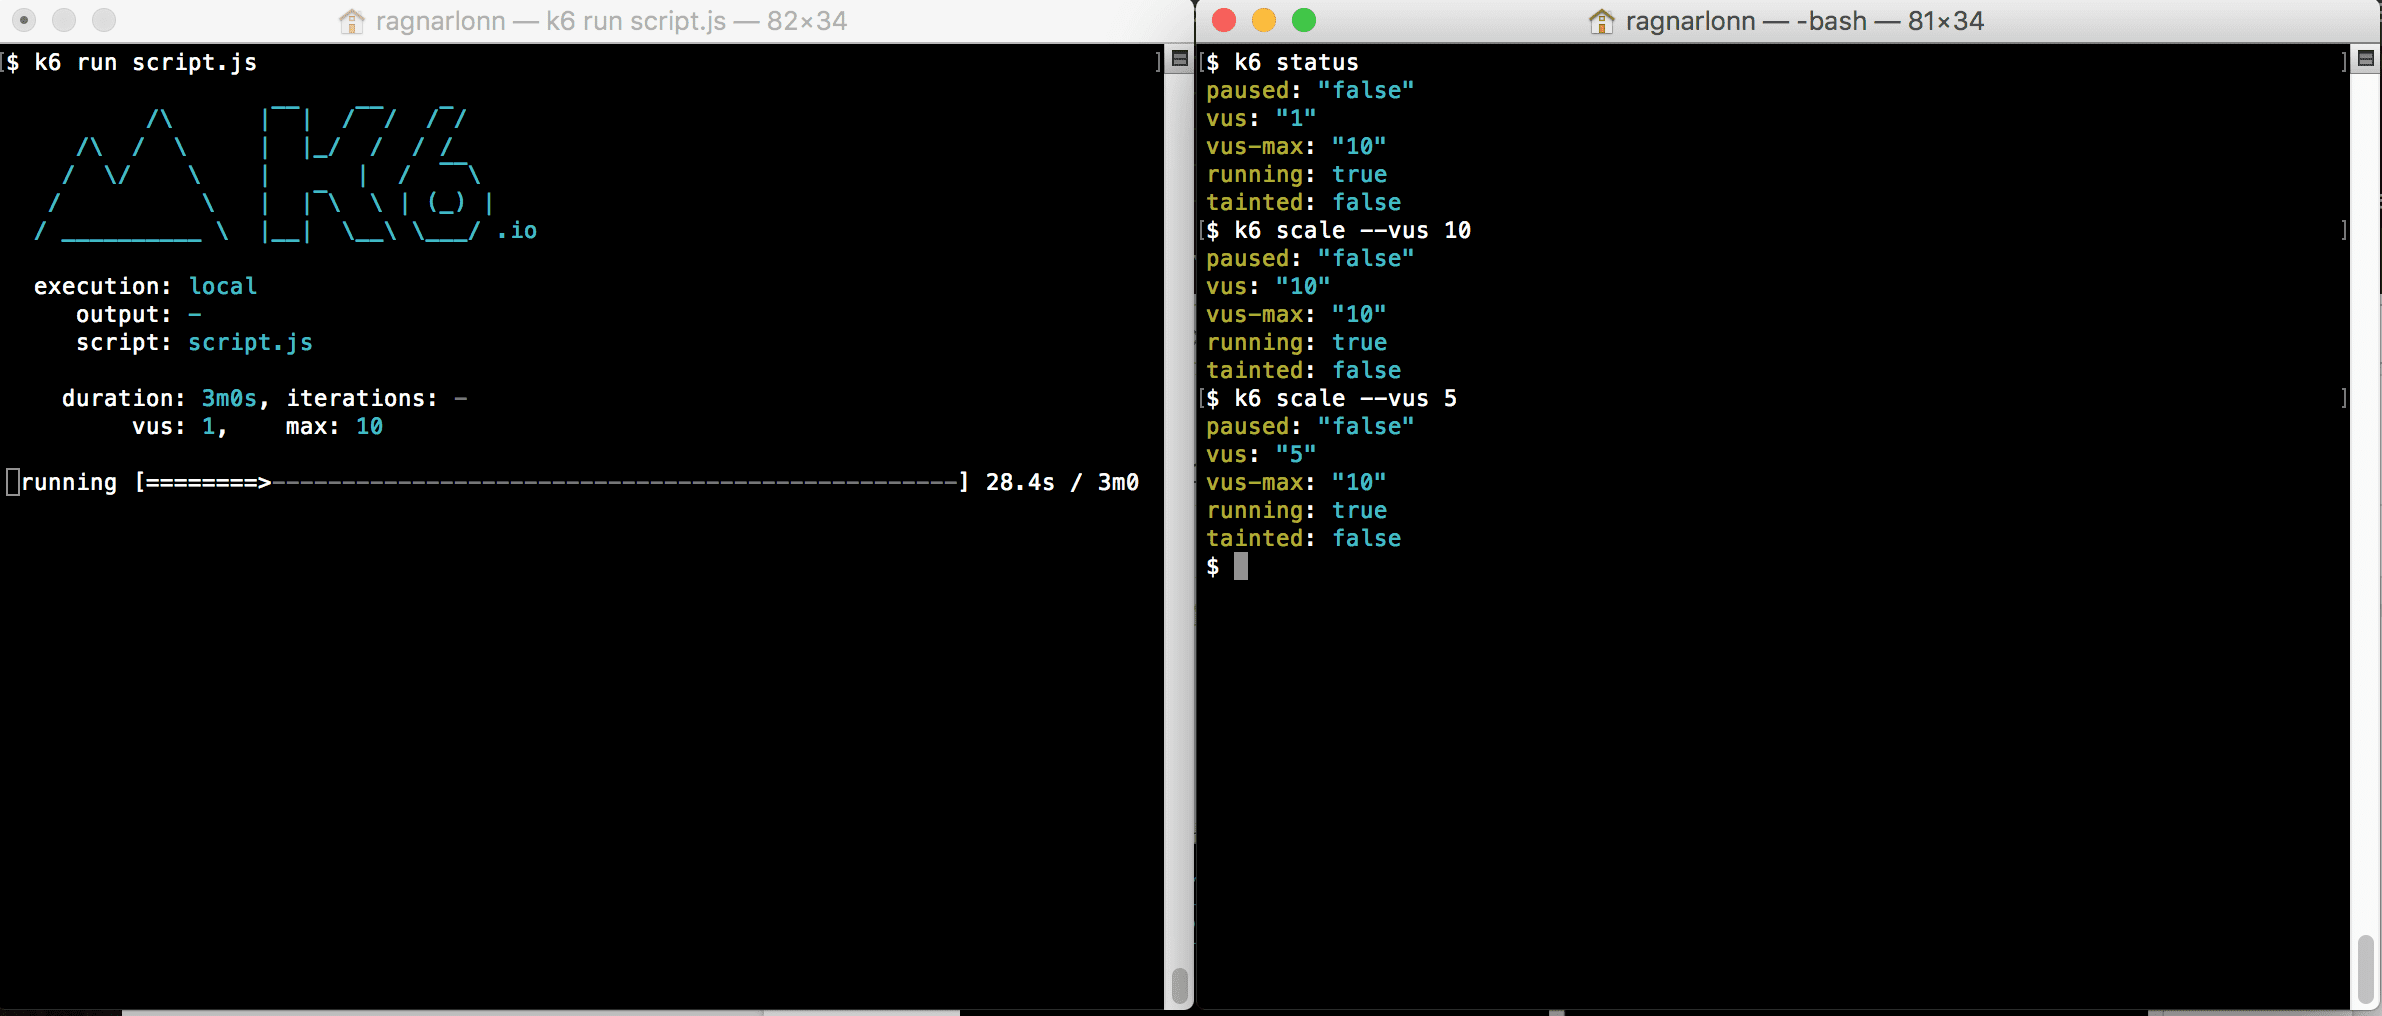
Scale:
This command allows you to scale the load level (number of VUs) up or down during the test.
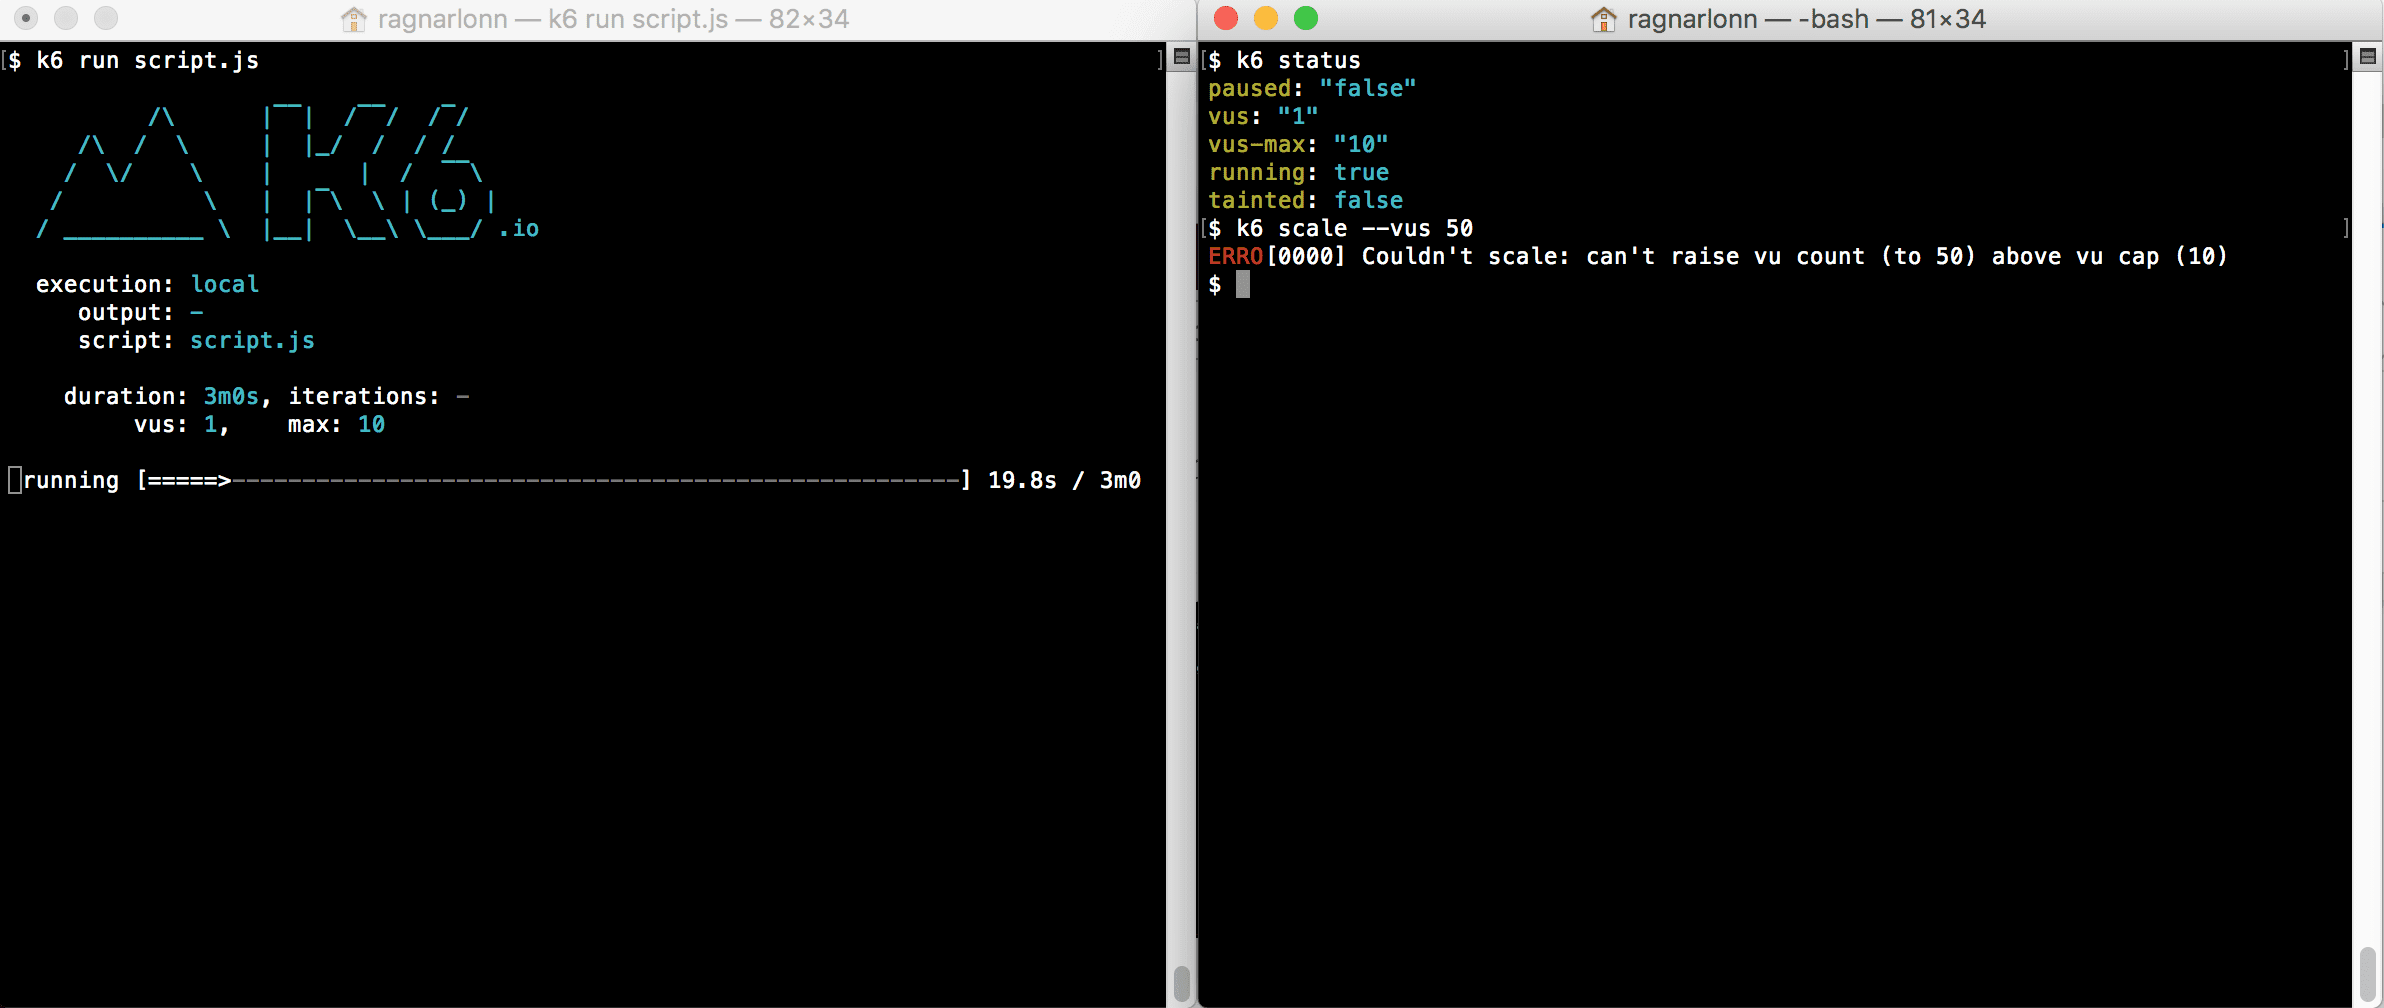
What is vus-max in k6?
Note that there are two VU parameters: vus and vus-max. The first one is the actual number of currently active VUs in the test. It is the one you use to ramp up and down the load level. The second value (vus-max) is the current limit for how many VUs you can activate. This is what happens if you try and scale vus to a level that is above vus-max:
The vus-max parameter exists because creating new VUs is an expensive operation: you need to reserve a lot of memory and initialize a lot of data structures. Initializing a large number of new VUs during the test execution may negatively affect the load test itself (halting it for a while or affecting the reliability of the measurement).
If it was simple to arbitrarily change the VUs number during the test, users might encounter problems when starting the test with a small number of VUs and then scaling it to a significant increase. So k6’s way of trying to both make users continuously aware of this issue, and still provide flexibility, is to have the vus-max parameter that you need to set before you set the vus parameter. It also gives users more control; Increasing vus-max means that k6 will immediately start allocating memory etc for the extra VUs.
The user can decide when k6 should spend CPU resources on allocation and configuration, and when it should use the CPU to actually generate load testing traffic and perform accurate measurements.
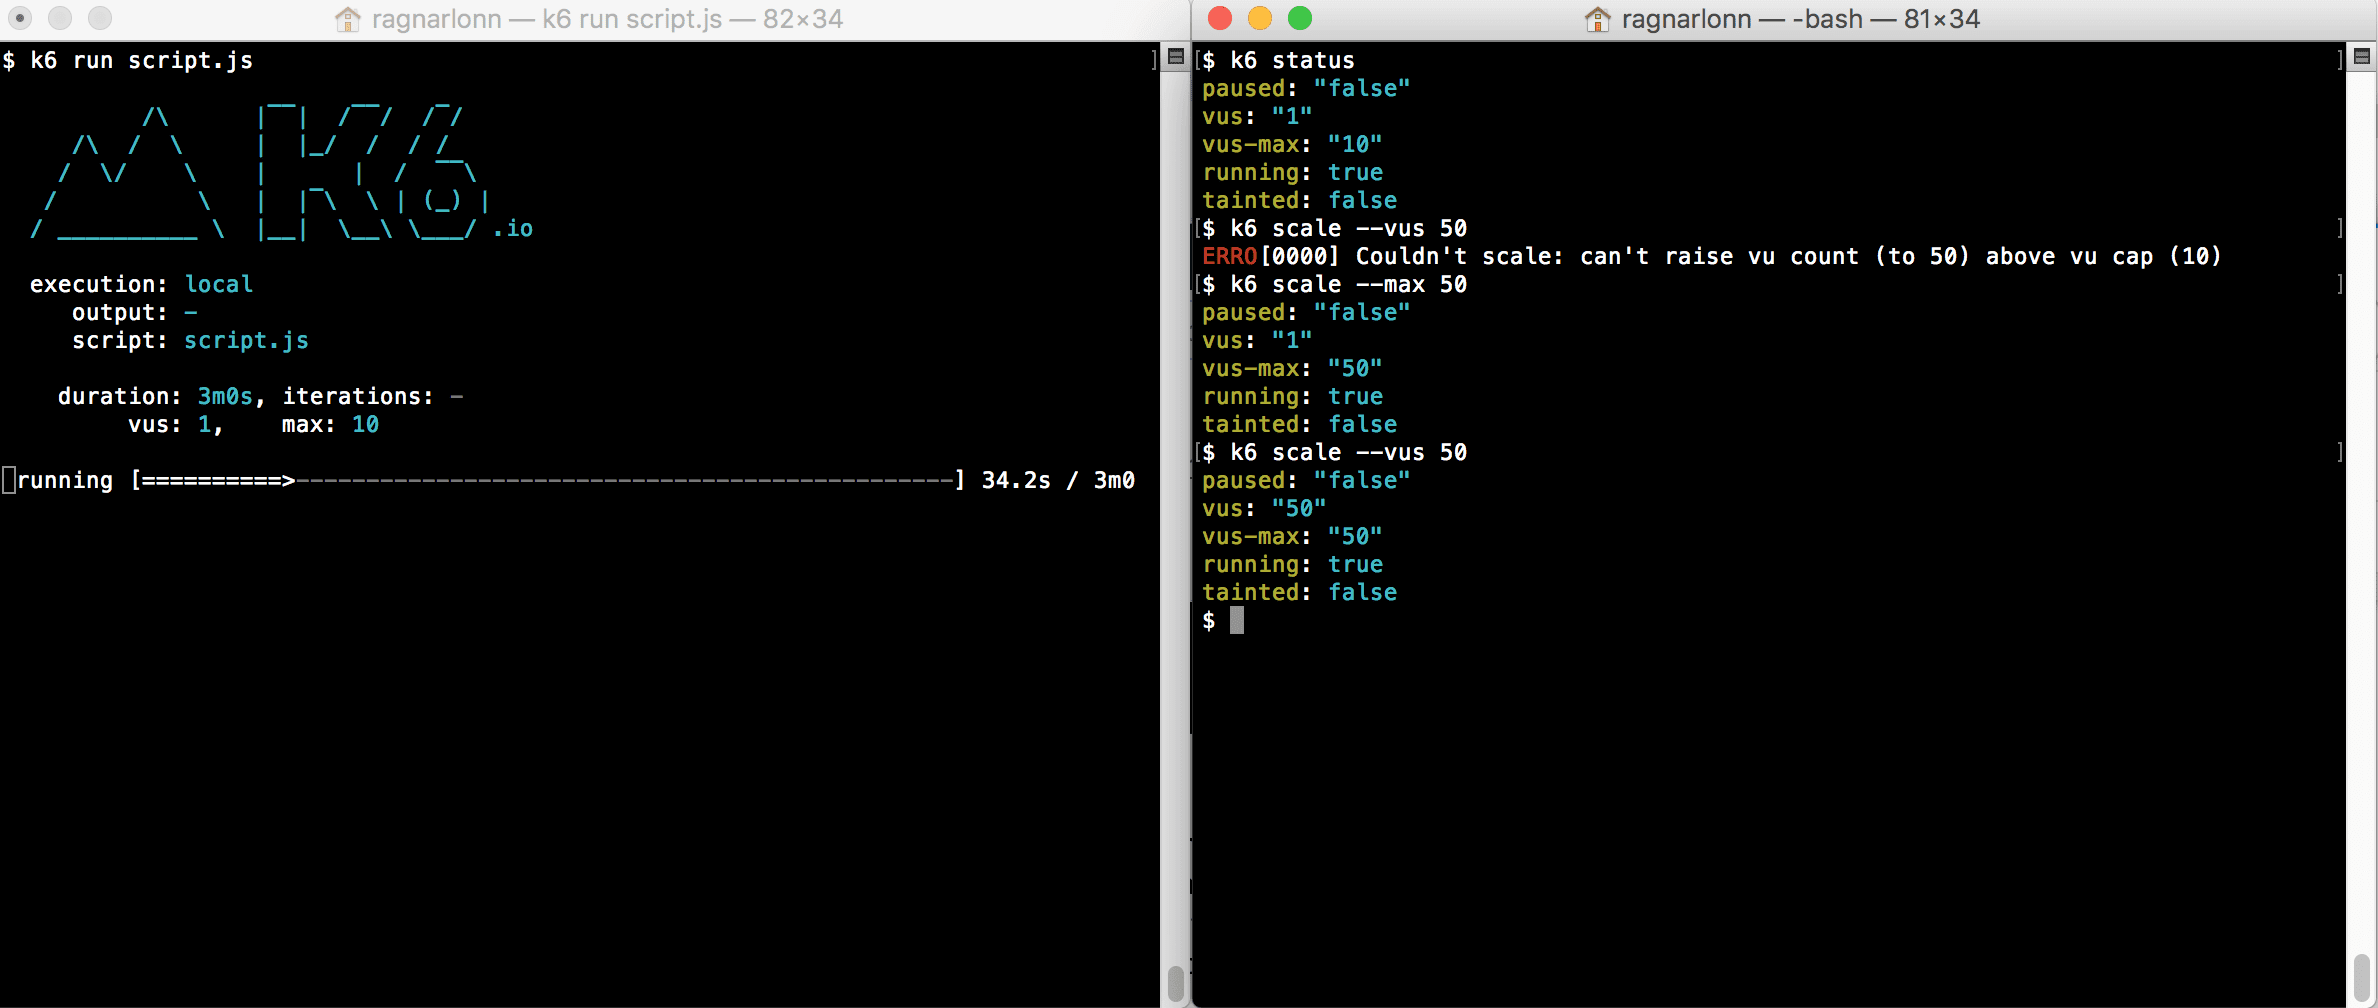
Here is an example in which we increase vus-max from 10 to 50 VUs during the test, which is generally not recommended, but at low load levels there is no noticeable slowdown:
How to configure vus-max in k6?
The best thing is to set vus-max once, on startup, and set it high enough that you will not need to increase it at runtime. The second best thing, if you do need to increase vus-max at runtime, is to pause the test, increase vus-max, and then resume again. That way, nothing important happens while k6 is busy creating new VUs.
You can also do what we did in the screenshot above and just change vus-max while the test is running, without pausing it first. Just be prepared for wonky test results or a temporary hiccup in test traffic if you do this.
How to Control Tests in k6 Remotely?
Starting k6 in one terminal window, and controlling it from another window on the same machine may not seem very “remote”, but you can control k6 instances from anywhere, as long as you can communicate with the machines where they are running.
What happens behind the scenes here is that the original k6 process starts an HTTP server, exposing a REST API on localhost:6565. With this API you can see and control different execution aspects like number of VUs, Max VUs, pause or resume the test, list groups, set and get the setup data and so on.
By default, k6 scale and the other commands will assume you want to talk to a k6 process that is running its API server on localhost:6565, but you can use the -a/–address command line option to specify both the bind address/port for the API server (e.g. k6 run –address 1.2.3.4:5678 –paused myscript.js) and where the k6 that you want to control is located (k6 scale –address 1.2.3.4:5678 –vus 50).
Get Status
curl -X GET \
http://localhost:6565/v1/status \
-H ‘Content-Type: application/json’
Update Status
curl -X PATCH \
http://localhost:6565/v1/status \
-H ‘Content-Type: application/json’ \
-d ‘{
“data”: {
“attributes”: {
“paused”: true,
“vus”: 1,
“vus-max”: 1
},
“id”: “default”,
“type”: “status”
}
}’
PATCH allows you to pause/resume the current test and set the number of vus and vus-max during the test.
List Metrics
curl -X GET \
http://localhost:6565/v1/metrics \
-H ‘Content-Type: application/json’
This endpoint will give you all the metrics in the current time. You can see more details on all metrics available and how to create new ones above.
Get Metric
Detailed information on a specific metric at the current time.
curl -X GET \
http://localhost:6565/v1/metrics/http_req_receiving \
-H ‘Content-Type: application/json’
List Groups
List groups returns all groups available in the test.
curl -X GET \
http://localhost:6565/v1/groups \
-H ‘Content-Type: application/json’
Get Group
This endpoint returns a group with the specified ID.
curl -X GET \http://localhost:6565/v1/group/
b0470a9324a4ae563b04e9ac49fbc9cf \
-H ‘Content-Type: application/json’
Get Setup Data
This endpoint returns the current settings in JSON encoding.
curl -X GET \
http://localhost:6565/v1/setup \
-H ‘Content-Type: application/json’
Run Setup
This endpoint performs the installation step and returns the result.
curl -X POST \
http://localhost:6565/v1/setup \
-H ‘Content-Type: application/json’
Update Setup
This metric analyzes the body of the JSON request and sets the result as the current settings.
curl -X PUT \
http://localhost:6565/v1/setup \
-H ‘Content-Type: application/json’ \
-d ‘{
“data”: {
“attributes”: {
“data”: {
“a”: 1,
“b”: 2
}
},
“id”: “default”,
“type”: “setupData”
}
}’
Stop Test
curl -X PATCH \
http://localhost:6565/v1/status \
-H ‘Content-Type: application/json’ \
-d ‘{
“data”: {
“type”: “status”,
“id”: “default”,
“attributes”: {
“stopped”: true
}
}
}’
Conclusions
You can compare k6 to other online performance testing tools using our parameterized comparison before you make up your mind. Each tool has its advantages and disadvantages, so it’s better to invest time in making a well-considered decision rather than try each and every tool out there. We have already tried all of them: our 400+ engineers have completed 300+ successful performance and load testing projects for businesses of different scales, so don’t hesitate to ask for advice in case you need it. We’ll be there for you!
Related insights in blog articles
Roles and Responsibilities of Performance Tester

The core of efficient performance testing is an experienced, certified and well-structured team of professionals, who have already worked in similar projects, and learned all the peculiarities of QA testing types, and protocols. If consciously chosen, they can evaluate a product, test its behavior under a load, check its response time, etc., and thus, empower […]
Tips for Efficient Web Application Performance Testing

Performance testing is one of the most challenging components of web application testing. But it is worth it: if done right, performance testing can forecast product behavior and its response to user’s actions with an impressive amount of detail and precision. Irrelevant web performance test data or wrong metrics chosen during testing cost companies a lot of money and effort, while not monitoring your web application performance at all can lead directly to a crash, say, on Black Friday, if you are not prepared to handle an increased number of concurrent users. Business or product owners needn’t know exactly how to performance test a website, but it’s useful to have a basic understanding of procedures that you pay for. From this post, you can learn what web application performance testing is, when it should be done, and how. Then, you will be able to make an informed choice whether to hire testing specialists or run testing sessions on your own.
Top Tools for Developers in 2024

The ratings of the best software development tools are time-sensitive: new tools emerge every now and then. Monitoring and mastering them is a full-time job, and sometimes a waste of time, too, since some oldies but goldies remain chosen by the team. Having done all the hard choices for you, we are sharing our list […]
Big Data Europe 2024

Big Data Conference Europe is a four-day conference with technical talks in the fields of AI, Cloud and Data. The conference will take place both on-site and online, providing the opportunity for everyone to participate in their preferred format.
Be first to know
Once a month we’ll be sending you a letter with all the useful insights that we could find and analise
People love to read
Explore the most popular articles we’ve written so far
- Android vs iOS App Performance Testing: What’s the Difference? Dec 9, 2022
- How to Save Money on Performance Testing? Dec 5, 2022
- Performance Testing: What It Is, and Why You Need It Oct 7, 2021
- Cloud-based Application Testing: Features & Types Apr 15, 2020