How to speed up JMeter. Part 2
We continue our series of articles about optimizing the popular load testing service JMeter. In the previous article, we highlighted the possibilities of significantly speeding up JMeter by configuring agent monitoring and optimizing components and service settings
In this part of the Apache JMeter load testing tutorial, we will focus on the script architecture, start, and parameterization of the service. By optimizing these components, you can quickly run 3, 4, 5, or 6 of intensity tests and get six reports in a minute.
Table of Contents
Script architecture
SharedHashMap and runtime
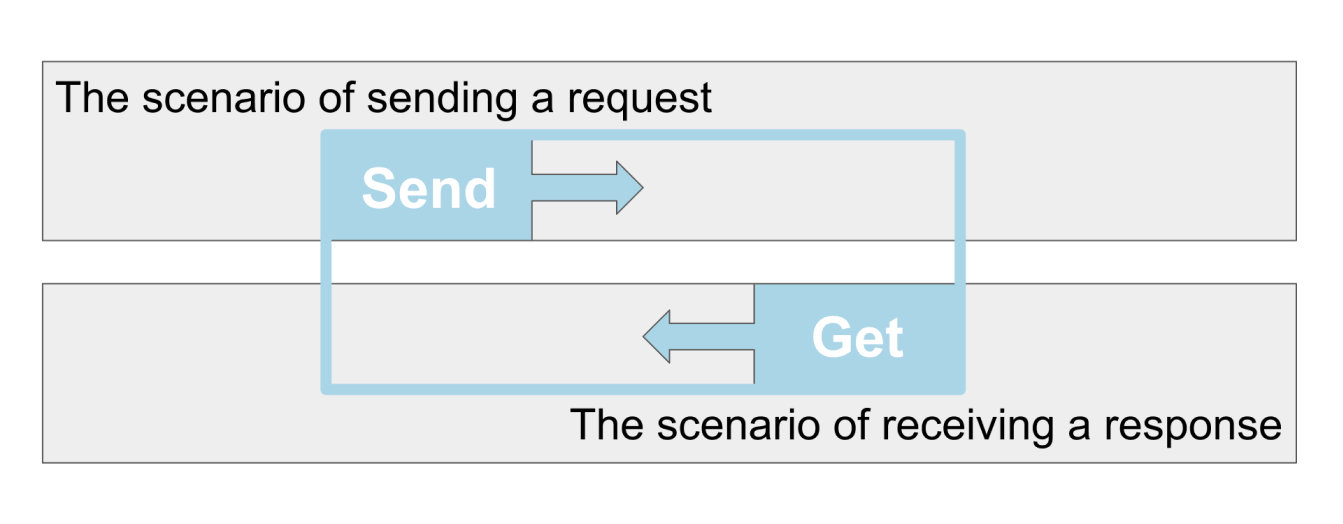
Imagine that your JMeter load testing is so complex that you need to send a request and then wait a long time for an answer. The first solution that comes to mind is to send a request and wait for an answer in a loop that uses JMeter, which is wrong.
SharedHashMap and time
How to measure time?
In one thread:
1. Send a request with ID
2. Save time by an ID key in the SharedHashMap
In another thread:
1. Receive a response and ID from the response
2. Receive time by ID from the HashMap
3. Create the SampleResult
We recommend the second solution: send a request in the first thread and wait for an answer in the second unconnected thread. What should be done when two requests that are located in different scenarios and that lack any common sessions have been merged into one transaction? In this case, we need to measure the runtime. Save the time when you sent the request. When you have received the answer, recall this time and generate the test results.
The feature of the SharedHashMap download in JMeter 5.0 – there may be a defect in the download component. If you have only static methods in the SharedHashMap class, then the methods of the class cannot be called by the JSR-223 Sampler. To consider a class as a class, we should add the non-static method test () in it.
You can write the code as follows:
import java.util.concurrent.ConcurrentHashMap;
public class SharedHashMap
{
private static final ConcurrentHashMap instance = new ConcurrentHashMap();
public static ConcurrentHashMap GetInstance()
{
return instance;
}
public String test() {
return “SharedHashMap”;
}
}
SharedHashMap and time
Save time in JMeter
def dateStart = new Date();
def sharedMap = SharedHashMap.GetInstance();
sharedMap.put(ID, dateStart);
Imagine that in one thread you need to send a request and assign an ID to it. For example, let’s create a request corresponding to the surname Fisher that will print the bank statement associated with the account. You send the request and with the key “Fisher” has saved the sent time in the memory. After receiving the answer for Fisher, we recall the sent time and created the SampleResult. In other words, we have integrated statistics in Apache JMeter load testing.
SharedHashMap and time
Receive time in JMeter and create the SampleResult
def dateEnd = new Date();
def sharedMap = SharedHashMap.GetInstance();
def dateStart = sharedMap.get(ID);
def start = dateStart.getTime();
def elapsed = dateEnd.getTime() – start;
def newRes = new SampleResult(start, elapsed);
prev.addSubResult(newRes);
Save the “def dateStart” variable in Date and save it with the key in sharedMap. When you have received the answer, you retrieve the send time from the Map. With the current and the preceding time, you can calculate the runtime and generate the SampleResult.
SharedHashMap and CSV
If your test is long and complex, the ID may become caught in an infinite loop. This happens when CSVDataSet finishes while we are waiting for an answer, so there are several IDs at work. To solve the problem, you need to save several events for each ID using a queue. You can see the code for these actions below.
SharedHashMap and CSV
Save time in JMeter*
def testData = [:];
testData[“dateStart”] = new Date();
def sharedMap = SharedHashMap.GetInstance();
def testDataQ = sharedMap.get(ID);
if (testDataQ == null) {
testDataQ = new LinkedBlockingQueue();
sharedMap.put(key, testDataQ);
}
testDataQ.add(testData);
SharedHashMap and CSV
Receive time in JMeter*
def sharedMap = SharedHashMap.GetInstance();
def testData = SharedMap.get(ID).poll();
if (testData != null) {
def dateEnd = new Date();
def dateStart = testData[“dateStart”];
def start = dateStart.getTime();
def elapsed = dateEnd.getTime() – start;
def newResult = new SampleResult(start, elapsed)
prev.addSubResult(newResult);
} else { … }
SharedHashMap and CSV
Generate the SampleResult*
def sharedMap = SharedHashMap.GetInstance();
def testData = SharedMap.get(ID).poll();
if (testData != null) {
def dateEnd = new Date();
def dateStart = testData[“dateStart”];
def start = dateStart.getTime();
def elapsed = dateEnd.getTime() – start;
def newResult = new SampleResult(start, elapsed)
prev.addSubResult(newResult);
} else { … }
Start and parametrization
We’ll explain how to spend a relatively small amount of time on test parametrization and quickly run tests on 3, 4, 5, or 6 intensity while receiving six reports per minute. You won’t even need to open the service, wait for it to load, or configure JMeter for load testing.
GUI and NonGui mode
If you want to use all resources possible, load testing using JMeter shouldn’t be started in the GUI mode. We recommend using the NonGUI mode because there are two problems with the graphical mode.
Use NonGUI
but not the graphic mode
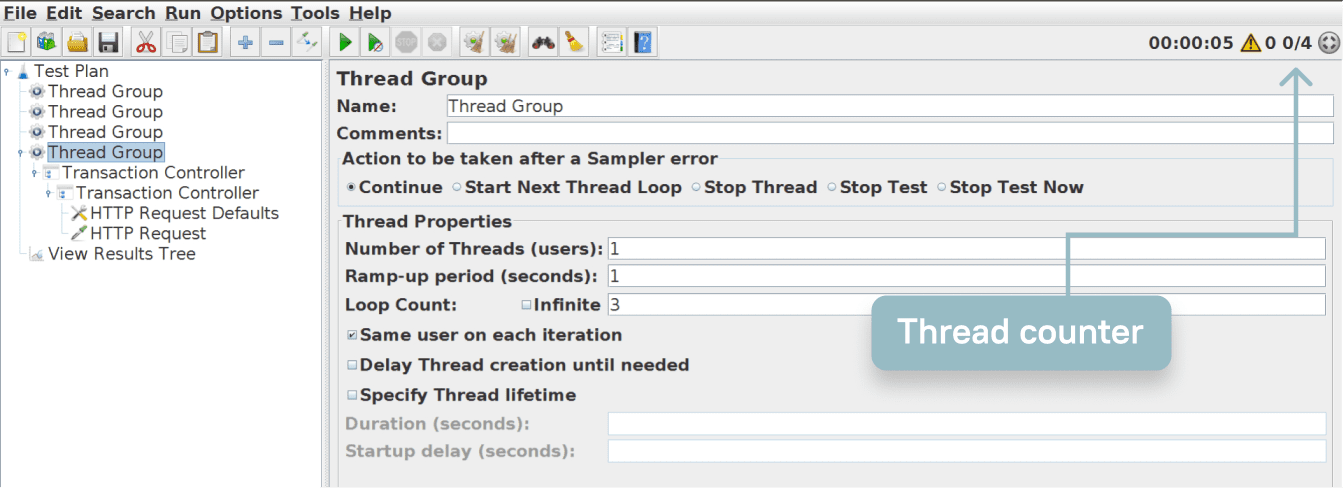
Firstly, thousands of threads are fighting over which number to write to the Thread Counter (in the right upper corner), which slows the process.
Use NonGUI
but not the graphic mode
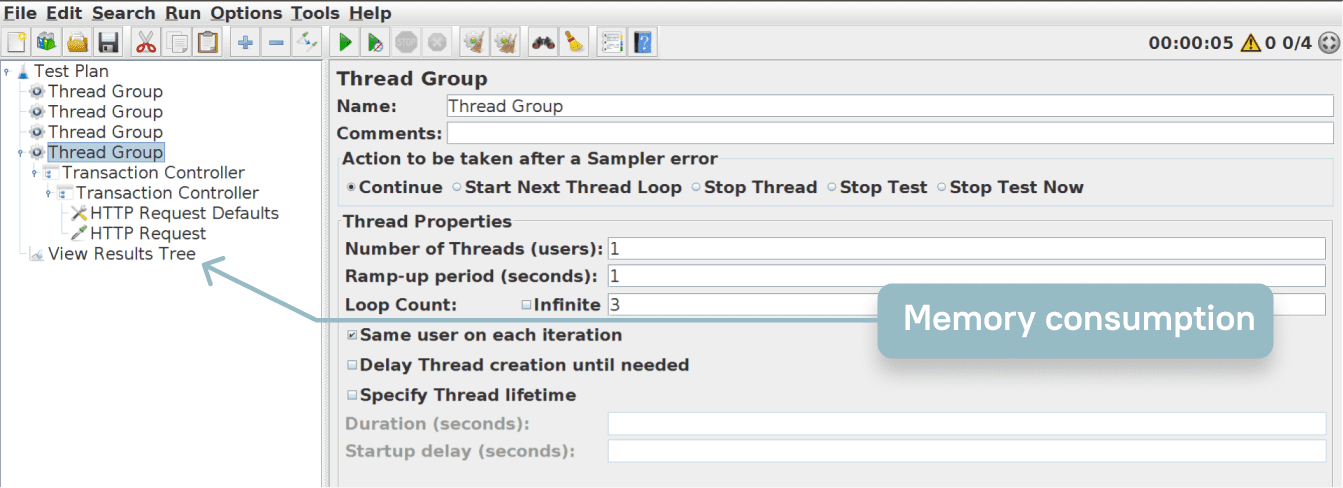
Secondly, if you are using a graph generator, it also uses some resources (e.g. wastes memory, saves answers, etc.). If you are using the NonGUI mode, then the resources are not spent on either problem.
IntelliJ IDEA for JMeter
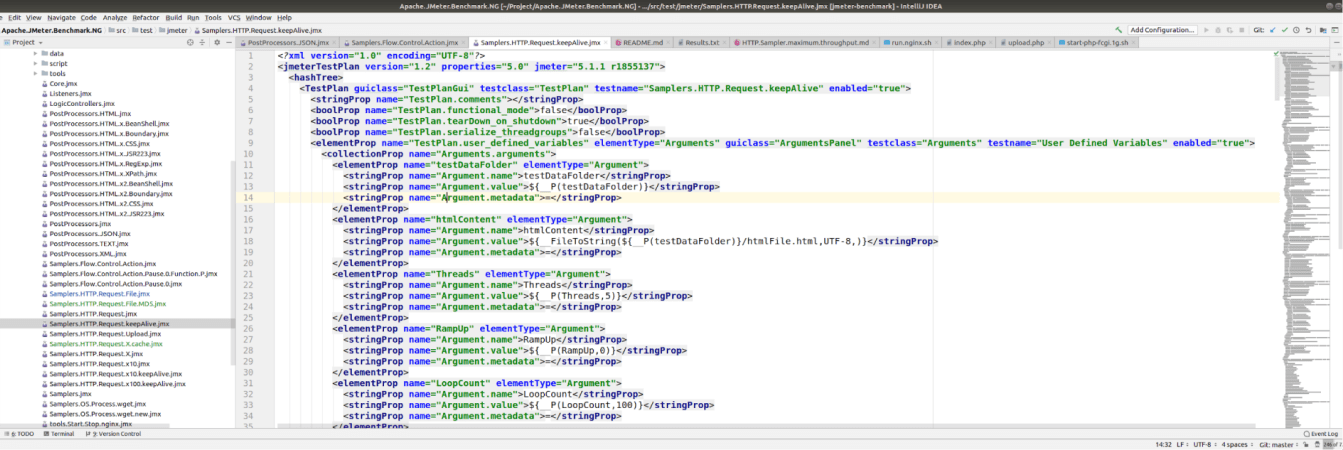
Develop scripts in IntelliJ IDEA. Although it’s not possible to write an XML JMeter script, the development environment supports syntax highlighting.
IntelliJ IDEA for JMeter
Fast refactoring
One example is a project that consists of JMeter scripts. You need all of them, but you remember that there’s one variable that must still be named. As a result, you’ve got 20 scripts and you need to change one variable in them. In IntelliJ IDEA, it’s convenient to find the faulty variable and change it to the correct one. If the change is not huge, your XML won’t break.
IntelliJ IDEA for JMeter
Save *.groovy in files
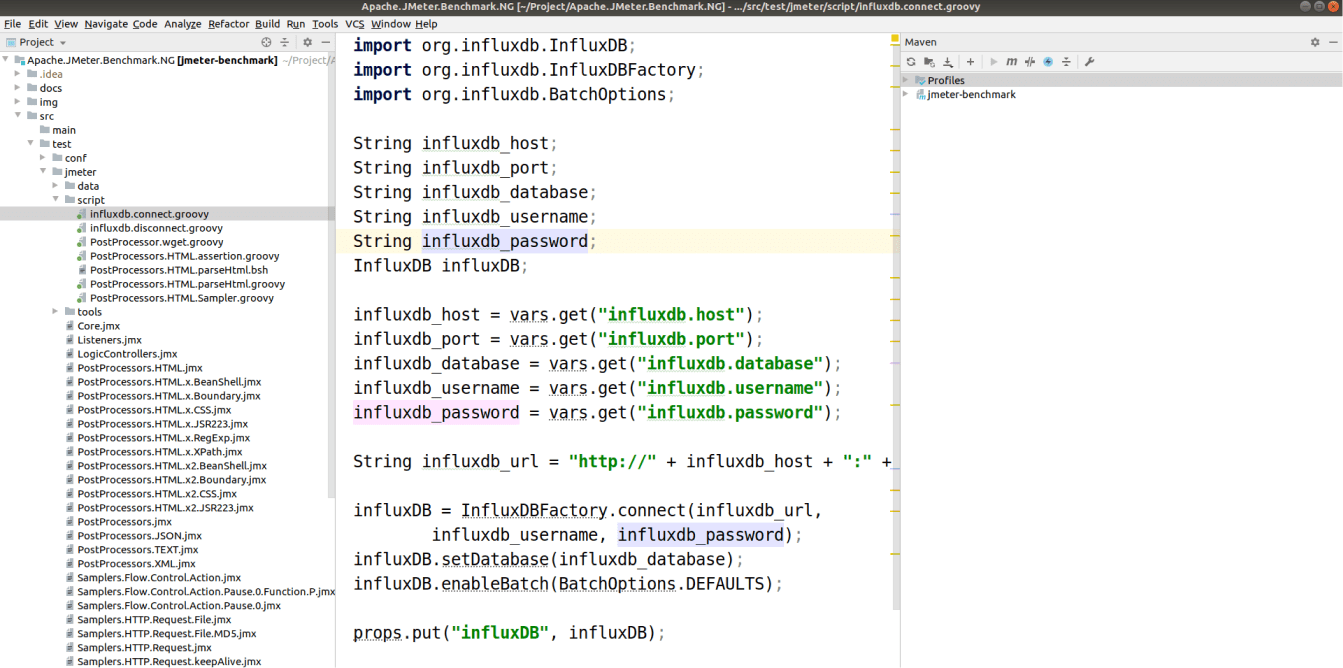
If you are actively using the JSR223 post-processor, you can export *.groovy scripts in separate files and attach them through the files. This way you won’t need to constantly open *.groovy in JMeter, edit the files, close them, run them in terminal mode, receive the response, and learn about an error. You won’t need to do it all over again. If you’ve got everything in the files, then you can edit them in IntelliJ IDEA. You’ll quickly receive the result without opening and running anything.
IntelliJ IDEA for JMeter
Control of versions with GIT
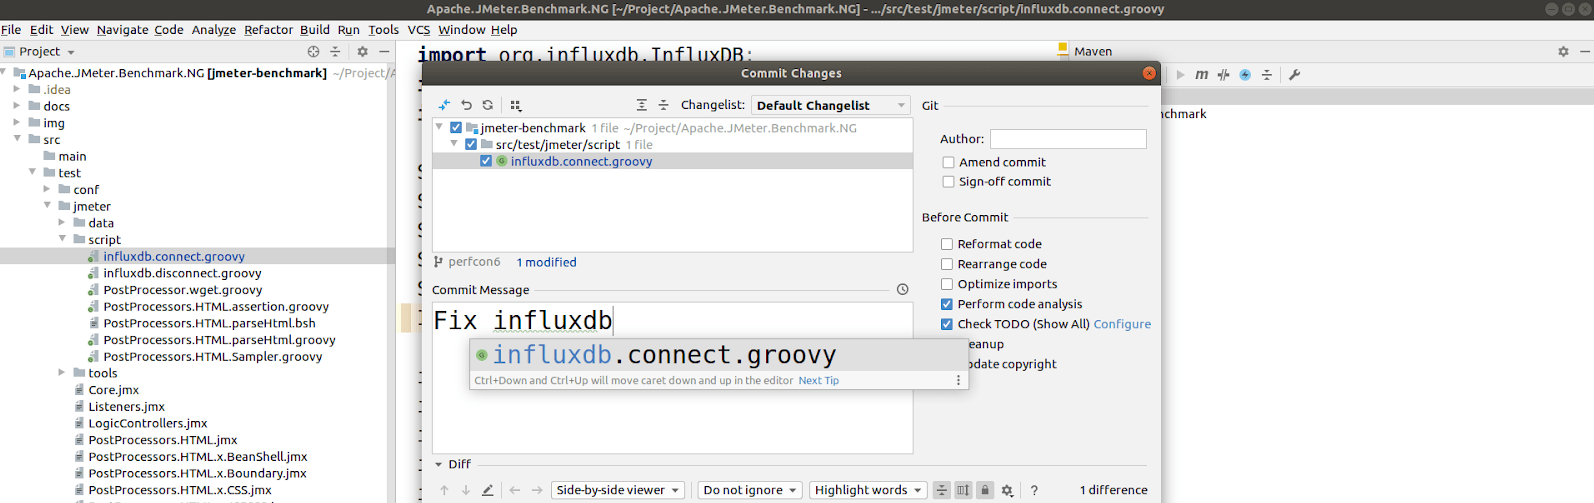
You’ll work conveniently in IntelliJ IDEA and will be able to go back to the desired branches thanks to the Git plug-in. If there is a problem with the script, and you need to test using the 134 version used half a year ago, you need only retrieve it to have the current JMeter script state with all configurations, etc. If you decide to compare the versions again, just go to the MasterHead.
IntelliJ IDEA for JMeter
Integration with Maven
IntelliJ IDEA is marvelously integrated with Maven, as it has a JMeter Maven plug-in. This plug-in simplifies work with JMeter scripts. Another benefit is that only a day is needed to learn enough to work with Maven.
Maven for JMeter
Maven for JMeter
Store libraries without the JAR
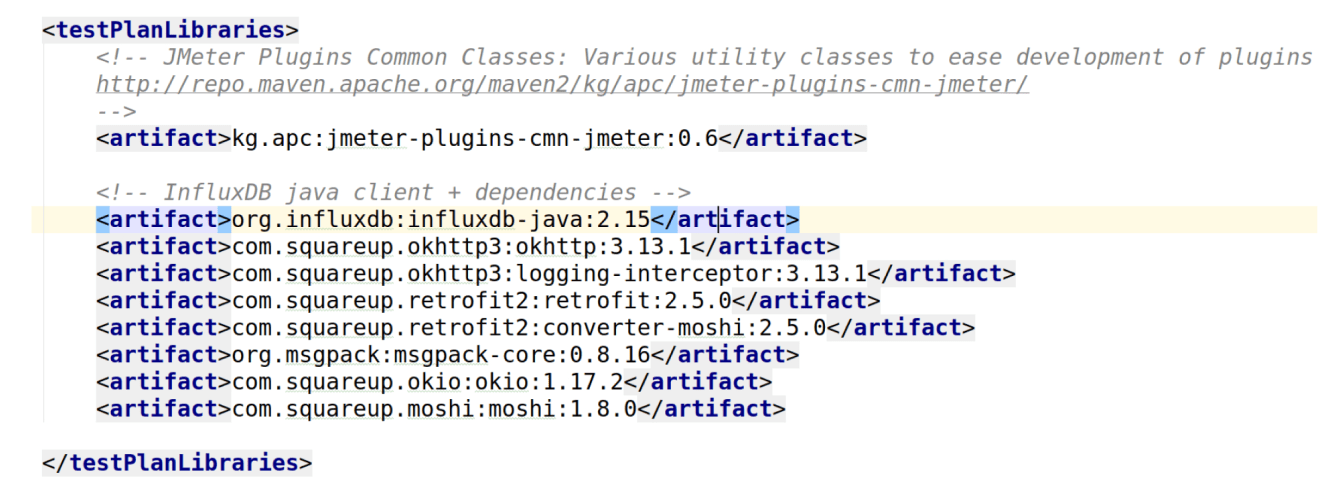
Maven allows saving libraries without saving the JAR themselves. So, you need only indicate the libraries’ names, and they will load.
Maven for JMeter
Management of dependencies
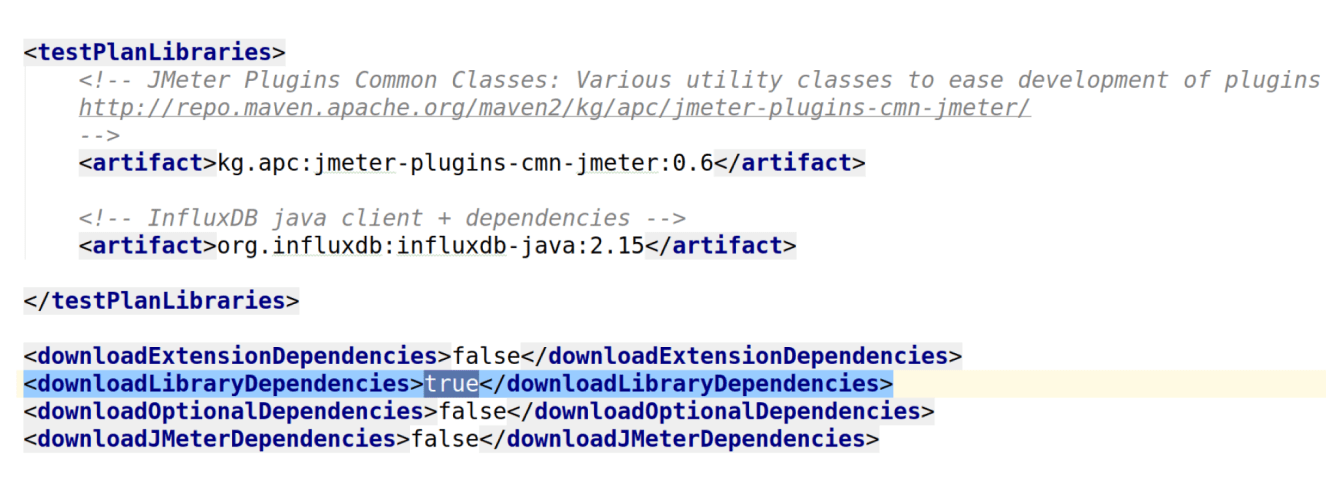
If you need to load dependencies, Maven will do that for you. You just need to set a task to load all required libraries.
JMeter Property
JMeter Property
${__P()} ‒ from props in vars
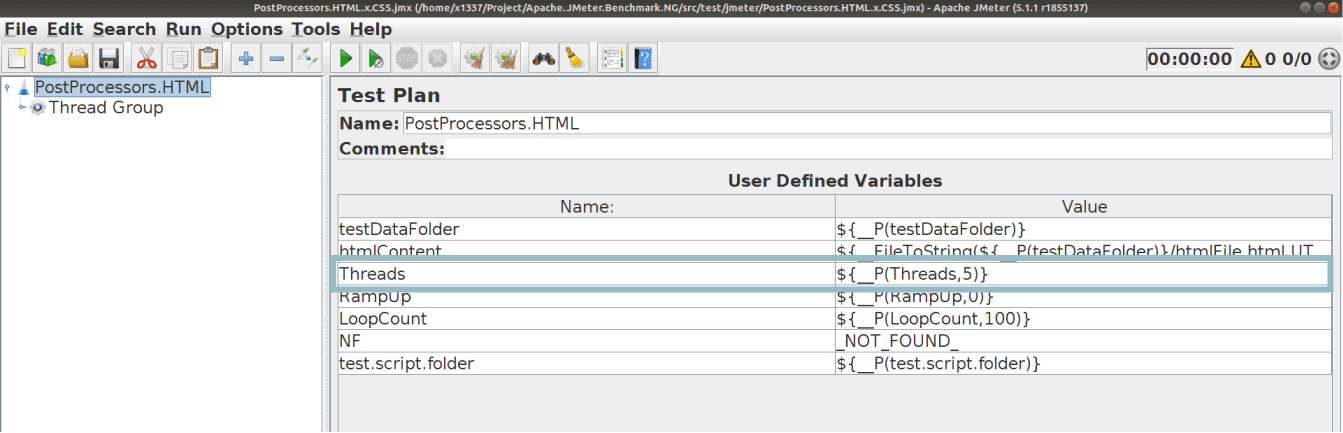
An easy parameterization approach is to parametrize JMeter scripts through the Ures Properties file in JMeter. For example, let’s move the amount of iteration from Properties to the Treads JMeter variable. To do this, we need to recall the function ${__P()}. It’s good practice to place the Properties load in an element called Test Plan. If your script depends on five variables, you define five variables and load them from props to vars to parametrize your script. It’s not entirely convenient to update the file through User Properties. We recommend using Maven Property for Apache JMeter load testing.
Maven Property
Maven Property
propertiesUser with Maven
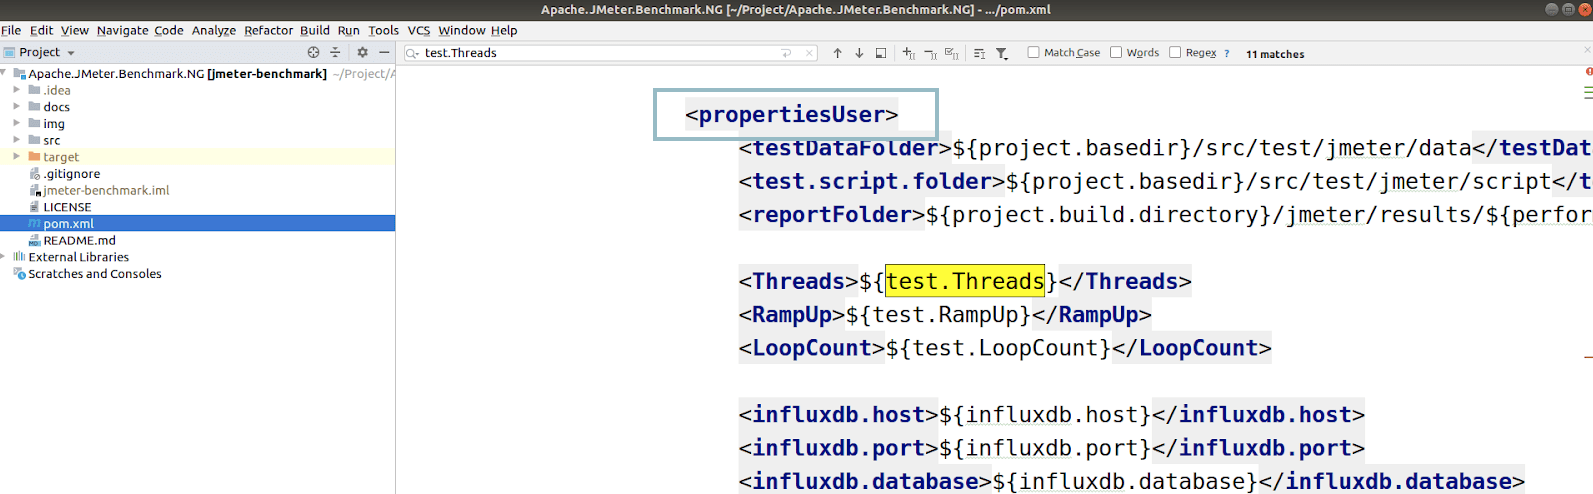
You can set custom values for propertiesUser using Maven. For example, the value of the Threads variable can come from the Maven profile, where you can set complete lists and sets of values.
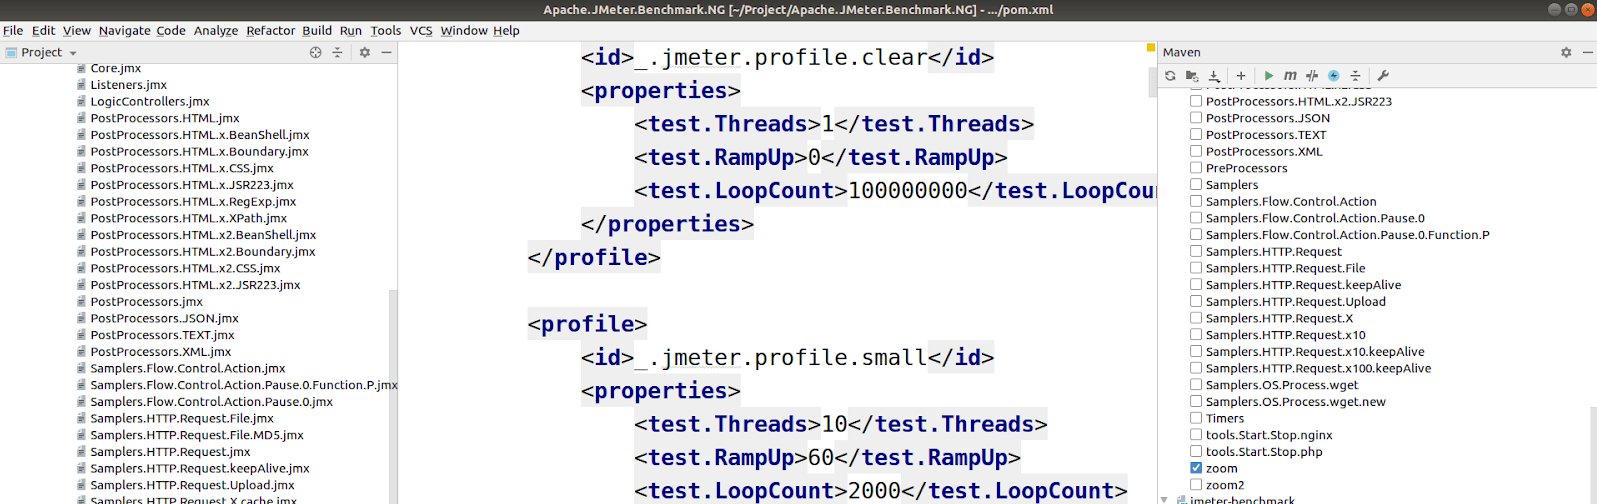
Maven Profile
Maven Profile
Inside the profile
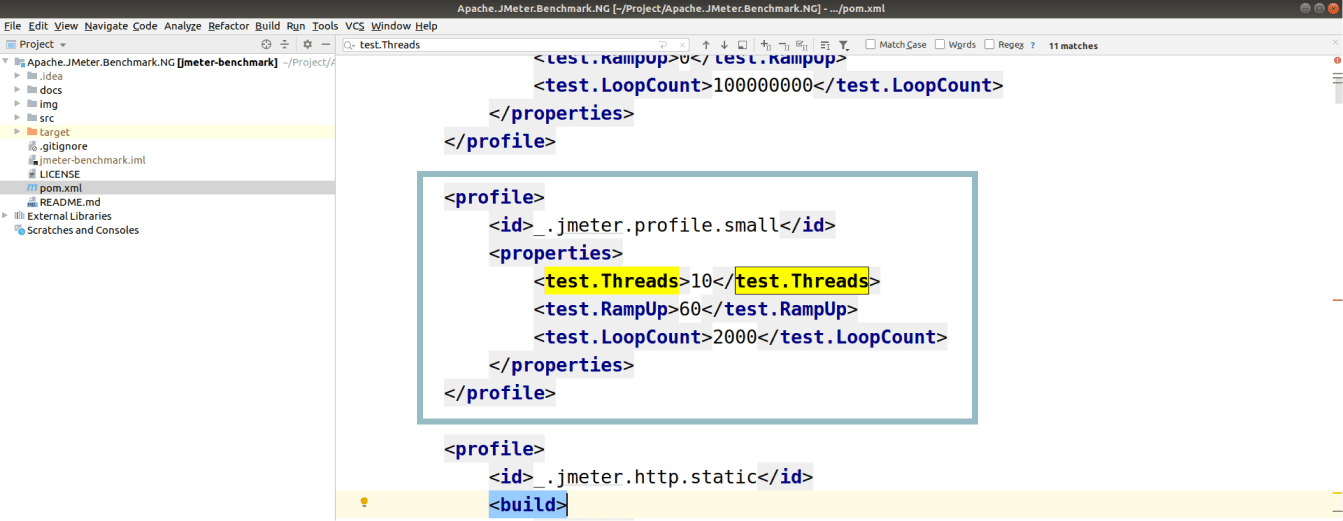
To illustrate, let’s call our profile “jmeter.profile.small”. It consists of three parameters: Threads – 10, RampUp – 60, LoopCount – 2000. Another profile “jmeter.profile.big” will have some larger values. You will change the parameters in one line to configure JMeter for load testing.
Maven Profile
Parameterization
mvn jmeter:jmeter -P _.jmeter.profile.small
| test.Threads | 10 |
|---|---|
| test.RampUp | 60 |
| test.LoopCount | 2000 |
Maven Profile
Parameterization
mvn jmeter:jmeter –P _.jmeter.profile.small –Dtest.Threads=1
| test.Threads | 1 |
|---|---|
| test.RampUp | 60 |
| test.LoopCount | 2000 |
You can use not only the -P key but also -D, which changes the chosen variables in the profile. That is, if you are using a profile with 30 variables and want to rerun the test with another number of iterations, then you use -D and test.Threads=1. The resulting set will be the same except for test.Threads. Consequently, you’ll generate an HTML report quickly without running JMeter and giving commands from the terminal.
Conclusion
We’ve often heard complaints about JMeter load testing performance from testing specialists and developers. Many of them asked us how to speed up JMeter. Surprisingly, there have been different problems behind bad JMeter performance.
In some cases, the user has simply configured JMeter for load testing and the load profile incorrectly, making it unreachable. At the same time, he or she wanted to receive 1 million queries per second. Other causes were technical, where we’ve discovered incorrect settings and needed to change the approach and the properties.
As long as you execute tests one by one and avoid using a thread, you don’t need to worry about their speed and resource consumption. But as soon as you need to run a load test from every build, you’ll want to decrease the load station pool and use as few resources as possible. It will be great when the target system freezes rather than JMeter!
As one can notice, the load times can be very different—1.5 seconds, 7 seconds, 5 seconds—which is hugely important. In some cases, we want to reach the minimal time. This is achievable! That’s why we’ve prepared this Apache JMeter load testing tutorial on how to optimize service’s work by changing the following testing process components:
- Scripts. It’s important to keep in mind that the scripts best optimize the product when correctly applied.
- JMeter configurations.
- Operational system configurations.
Have a Project in Mind?
We have been working on performance testing projects since 2008.
Drop us a line to find out what our team can do for you.