Part 3
Automating performance testing results: best practices
Programming with Grafana and InfluxDB for load testing engineers
In Part 1 of this tutorial, we had a close look on how to update your load testing environment to make load testing results automation possible. Instead of preparing your load testing report manually for days, with the environment discussed above, your data structure will depend on you, not you on your data structure.
In Part 2, we’ve tackled a problem that engineers in every load testing company complain about, — namely, how Grafana slows down the system, — and several other quick fixes to your Grafana dashboards. We plunged into multiple databases and data sources, retention policies and tag filters.
Finally, in this part we want to enable you to automate your test reports using all the infrastructure you have hopefully designed after reading through parts 1&2.
Table of Contents
Cache InfluxQL queries in Grafana variables
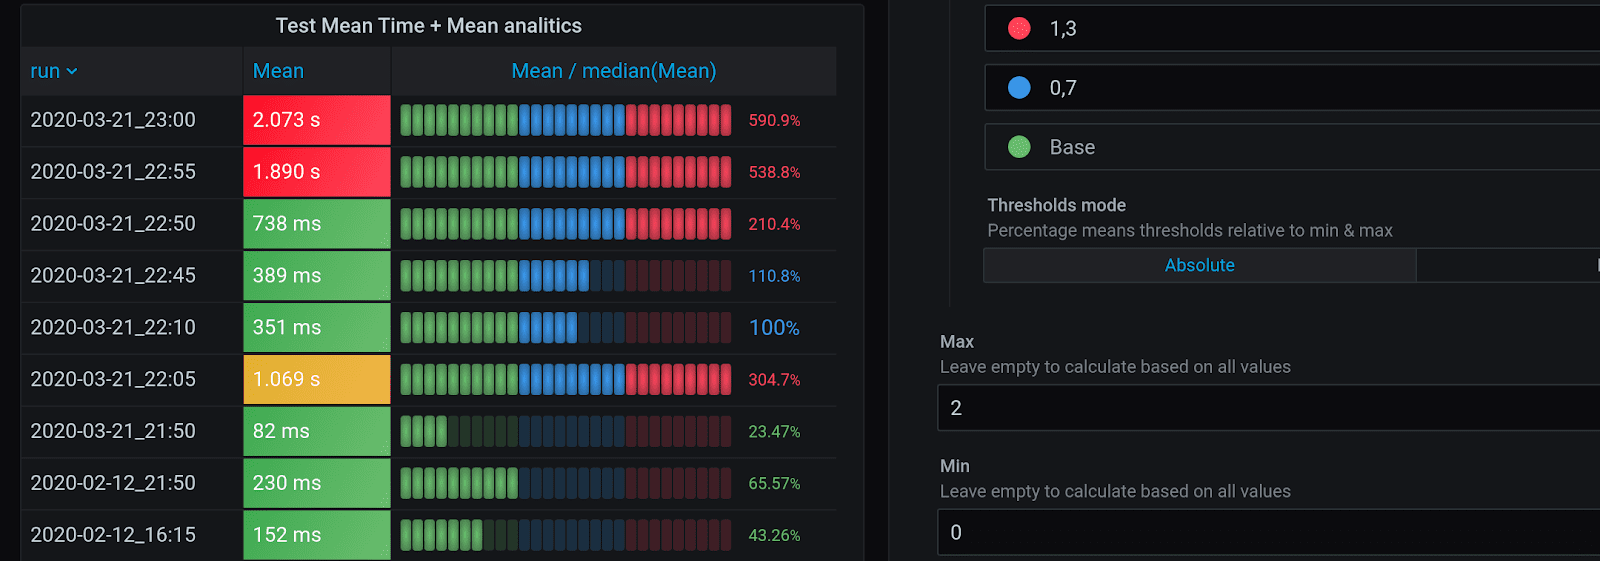
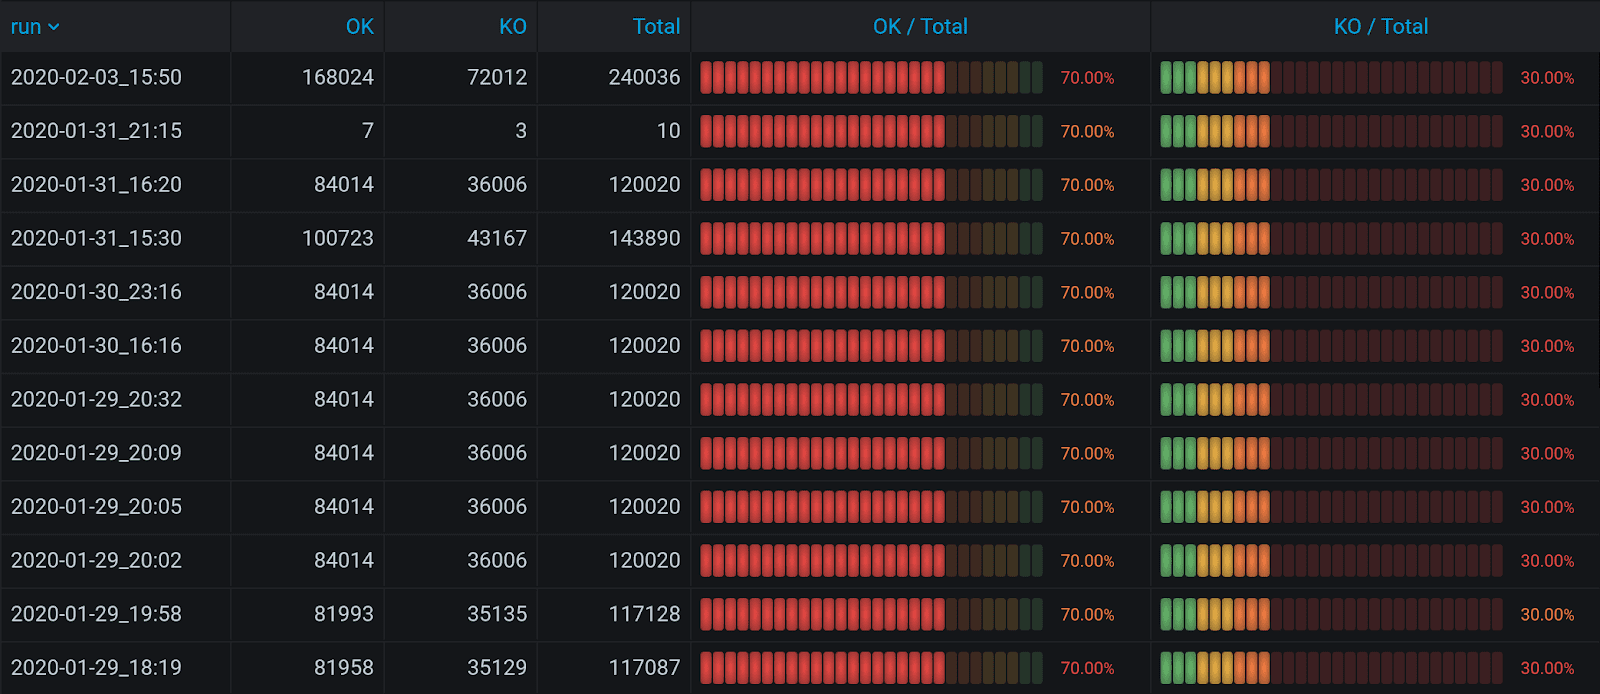
Imagine you’re at a stage at which you have run multiple tests and want to analyze their results automatically. As a result, you’d like to get something like this table: it summarizes tests that were ran for several months by OK, KO, Total, Mean, duration, Mean/median, Duration/median, OK/total, and RPS. A dream, huh? Very helpful to get analytics on successful and unsuccessful queries by duration, see how a particular test duration differs from the entire duration for all tests, and get the percentage of successes and failures.
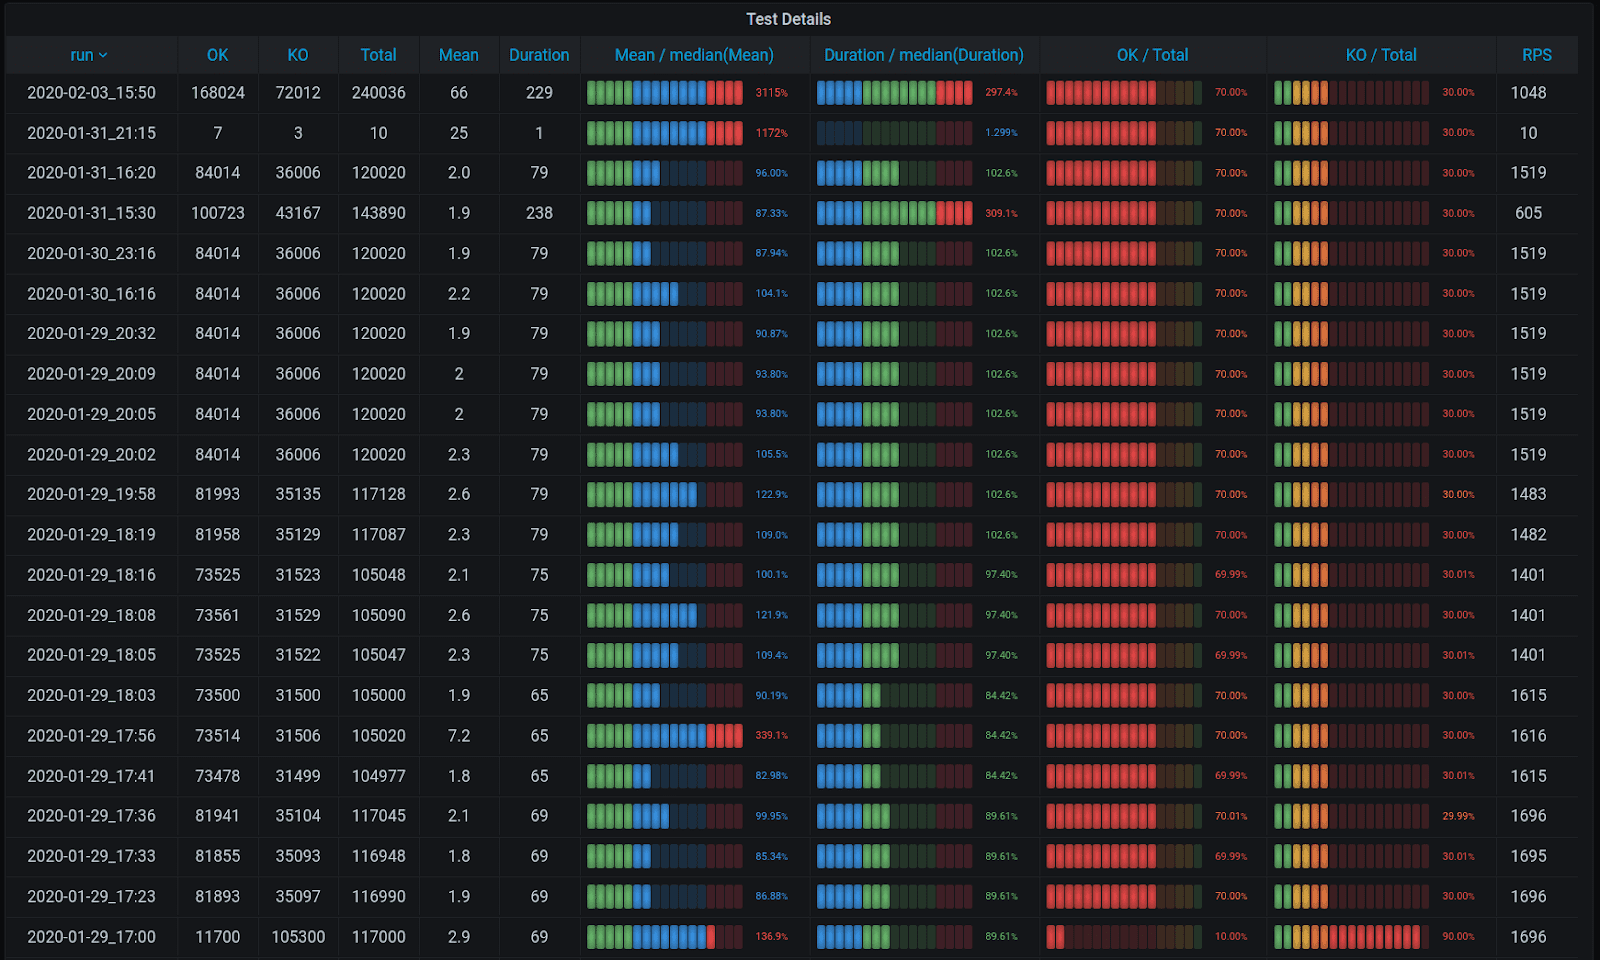
The simplest request to find average duration of successful queries will group the metrics that let you see that for a particular test the average time of a request was X, and for another one it equaled Y. But you will need to compare the results manually, which is time-consuming. The Threshold feature in Grafana that could help visualization only works well when there is a single column in your table. As soon as there is more, you need to create a mechanism to get analytics for one column only, otherwise it’s useless.
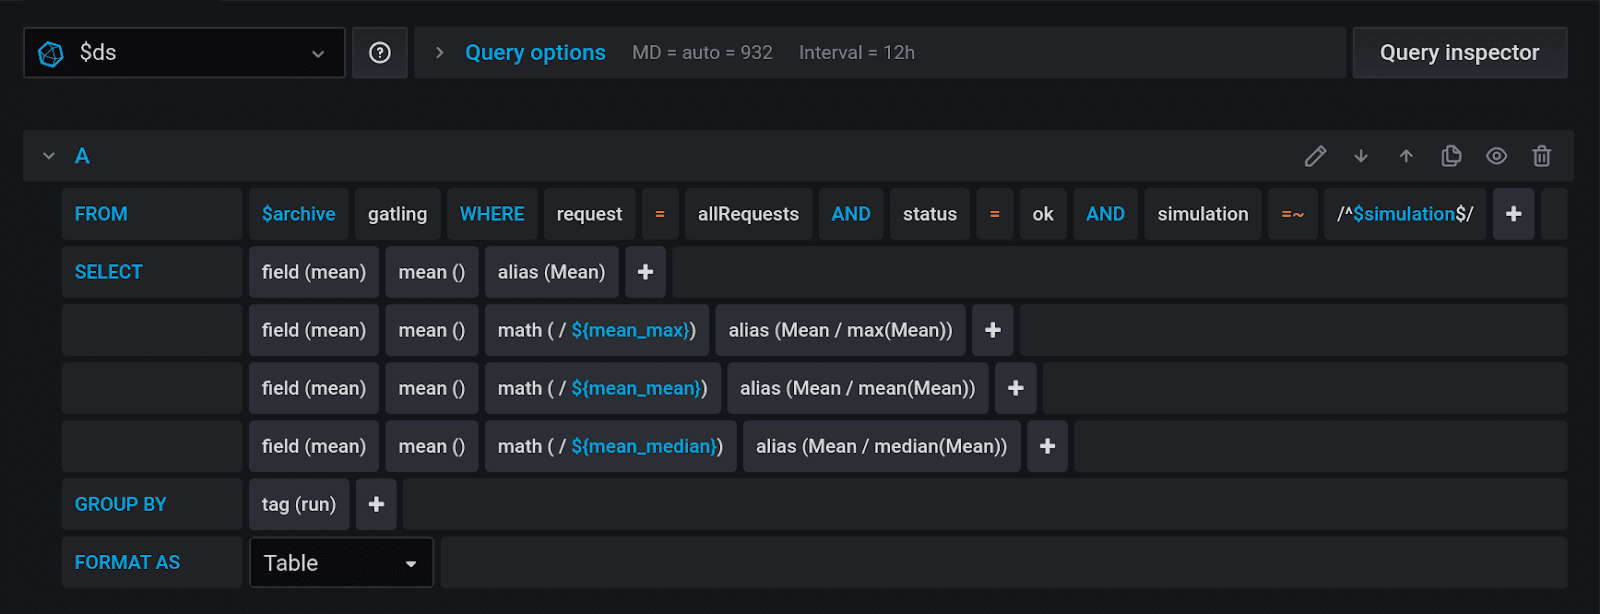
You will need to create three variables in Grafana. The first is called Mean_max, and it selects all the average values for the tests, and then selects the maximum among them using a subquery:
SELECT max(“Mean”) FROM (
SELECT mean (“mean” as “Mean”
FROM “$archive”.”gatling”
WHERE “request” = allRequests
AND “status” = ok
AND “simulation” = ~ /^${simulation^regex}$/
AND $timeFilter
GROUP BY “run”
)
The second is Mean_mean, and it calculates the mean value out of the mean values.
SELECT mean(“Mean”) FROM (
SELECT mean (“mean” as “Mean”
FROM “$archive”.”gatling”
WHERE “request” = allRequests
AND “status” = ok
AND “simulation” = ~ /^${simulation^regex}$/
AND $timeFilter
GROUP BY “run”
)
And Mean_median is a 50 percentile.
SELECT median(“Mean”) FROM (
SELECT mean (“mean” as “Mean”
FROM “$archive”.”gatling”
WHERE “request” = allRequests
AND “status” = ok
AND “simulation” = ~ /^${simulation^regex}$/
AND $timeFilter
GROUP BY “run”
)
Now, with these three variables, you can use a simple math operator in the InfluxDB query design to divide the current column into variables.
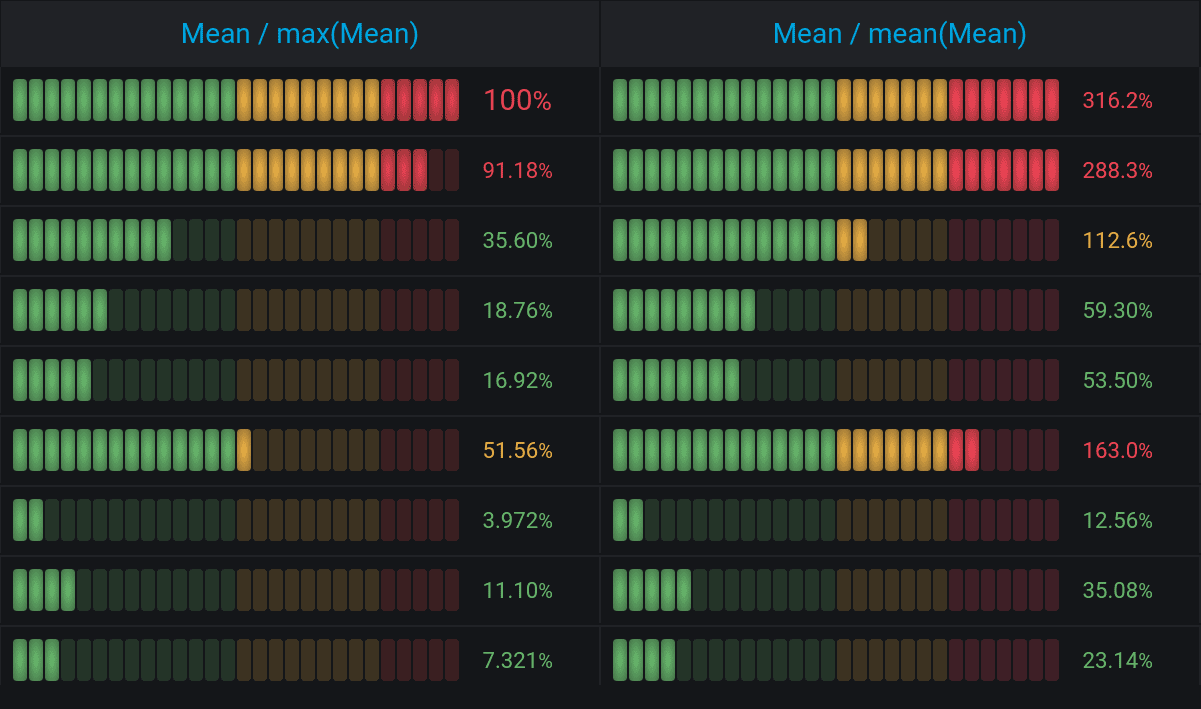
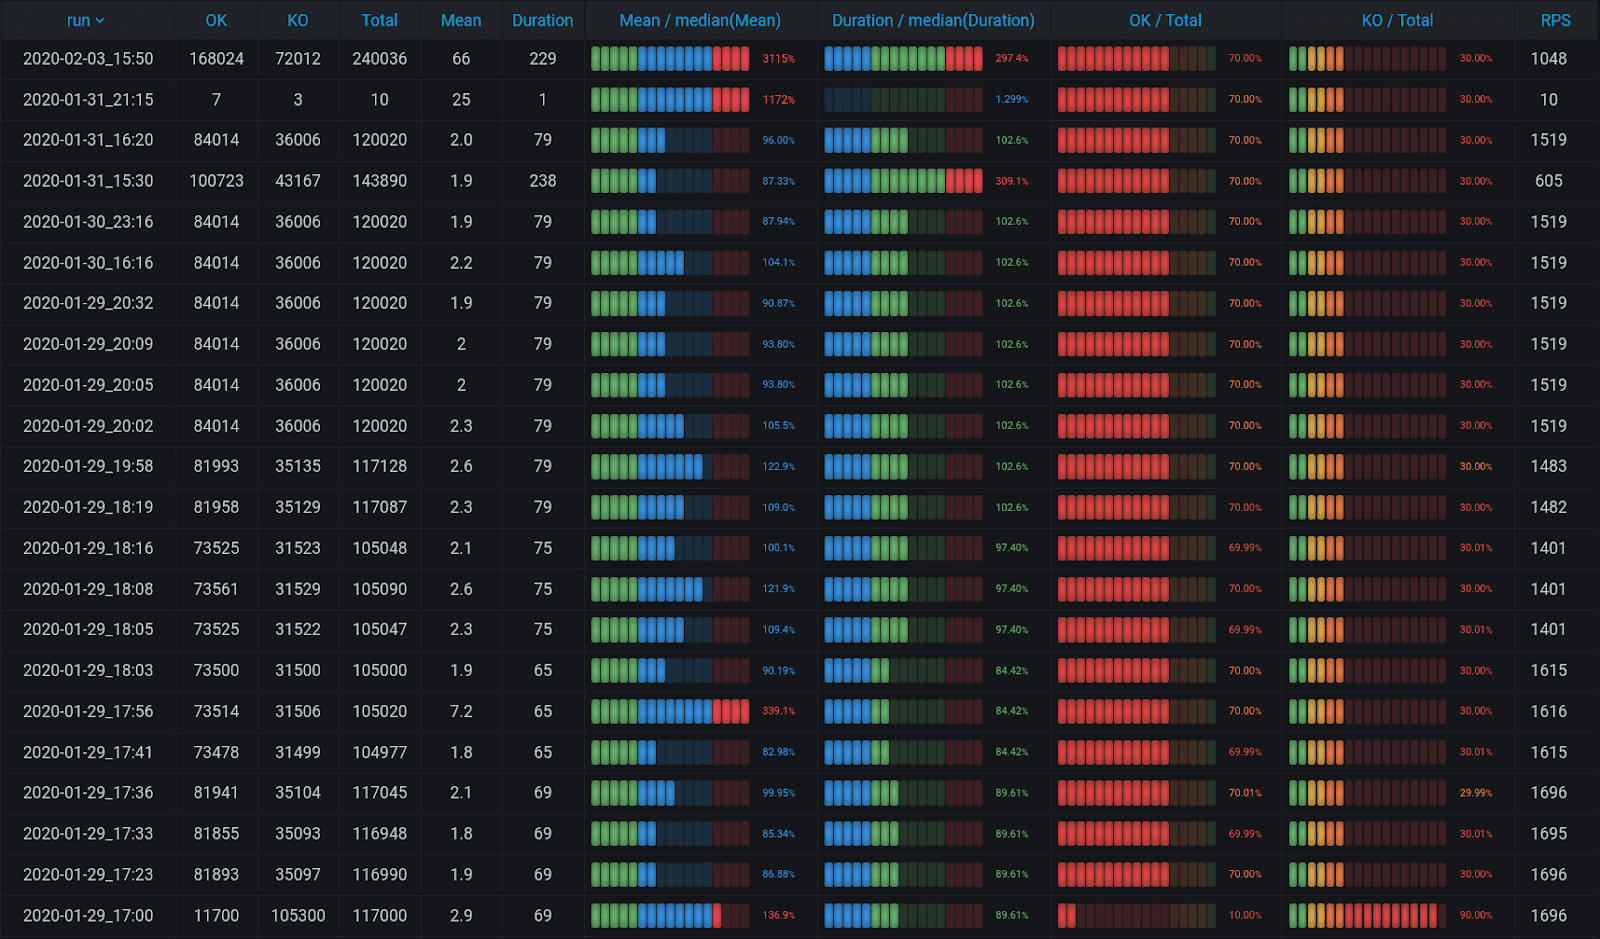
By the ratio of variables, you can determine whether the values are good or bad, since they become clear thresholds. Now it is possible to visualize everything neatly. Threshold for < 50% from Max is green, 50% to 80% from Max is yellow, while everything over 80% is red.
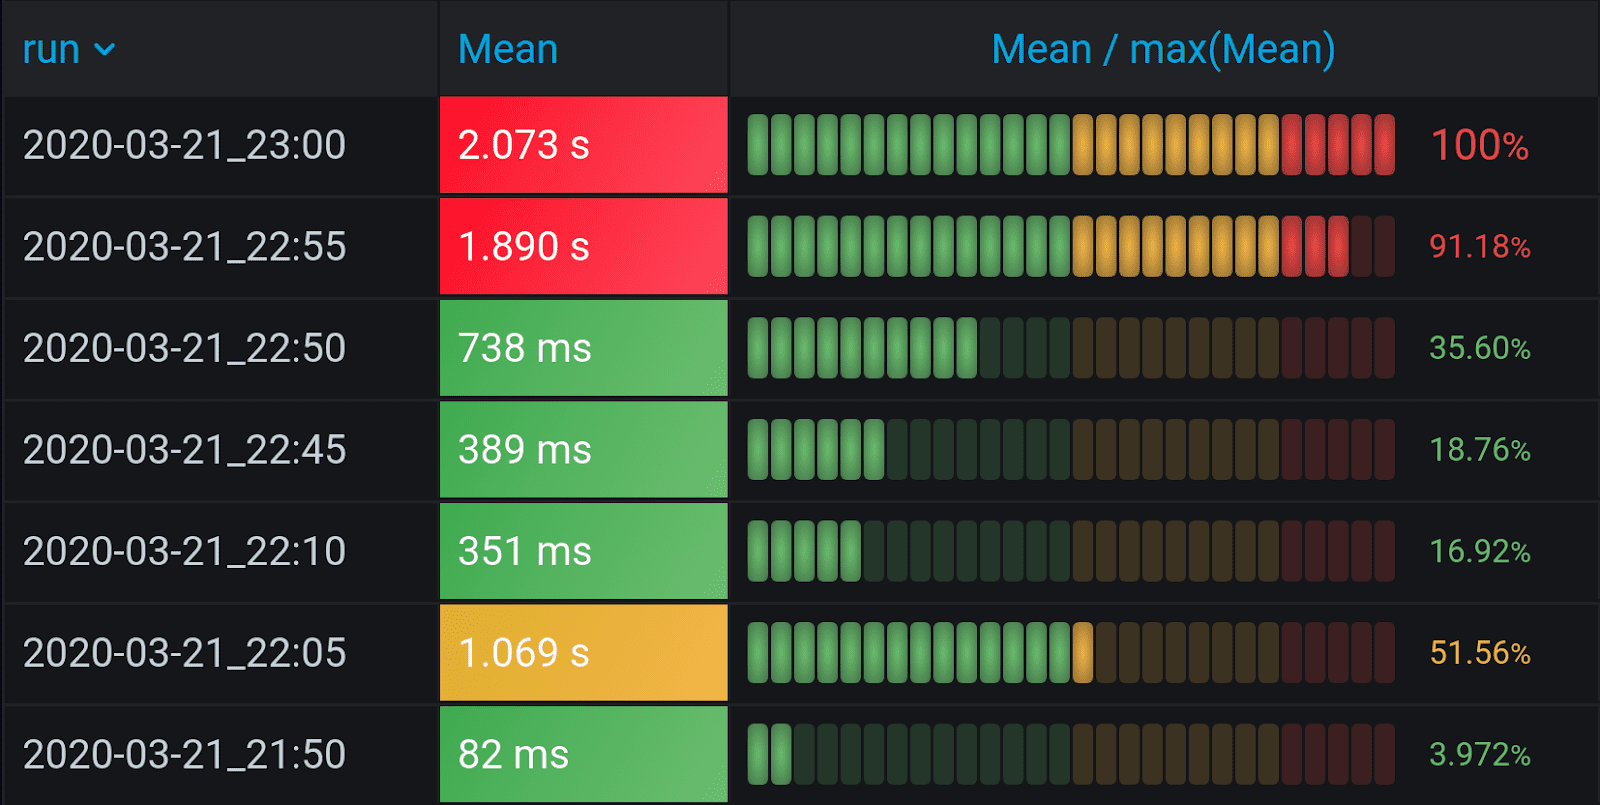
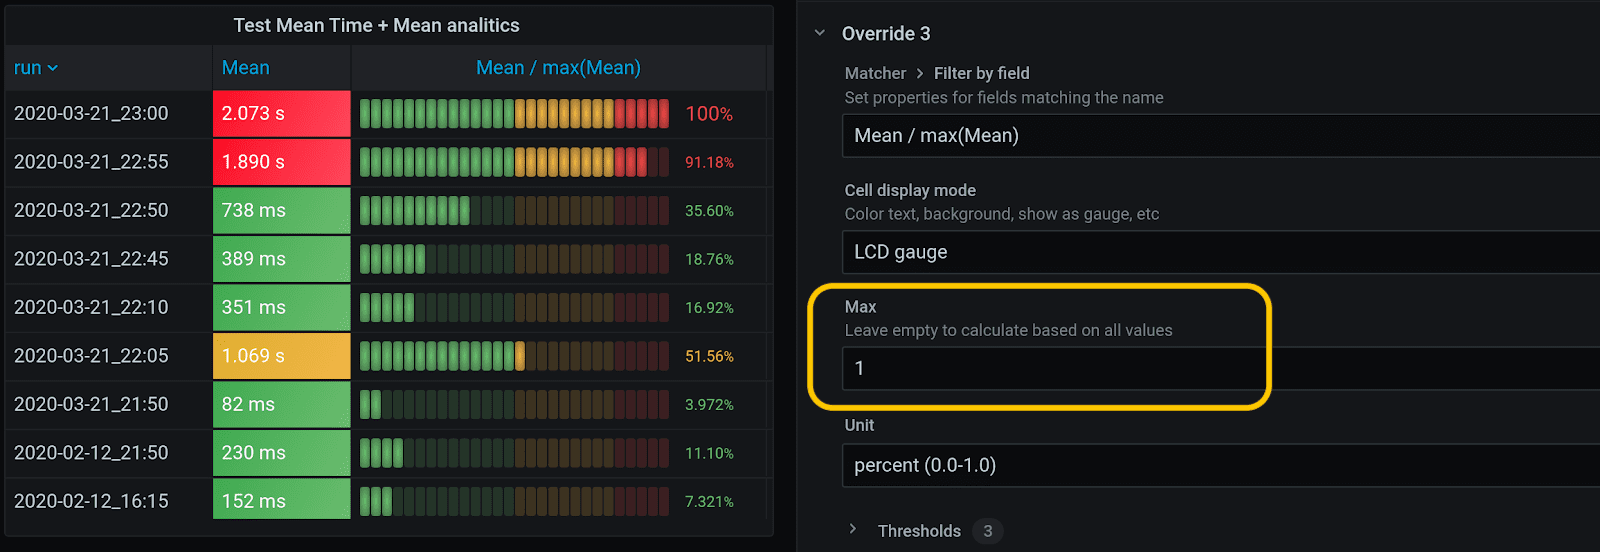
Set Max as 1, i.e., hardcode it. Thus, this interval is not calculated across the entire table, but becomes stable. The interval for Mean / max (Mean) will be from 0 to 1 (Min = 0, Max = 1).
The interval for Mean / mean(Mean) is more convenient if set from 0 to 2, since your average can exceed the average for the current test significantly. So thresholds should be different, too: everything over average should be yellow, everything lower than average – green, and everything 1.5 times over average should be red, for instance. Thus, there is more analytics in the picture, and we prefer it to the Mean / max(Mean) table, since it is balanced better.
But this analytics can be improved, too, because it is unstable and prone to peaks, failures and local outliers, but the median is stable. It is marked with blue below. Mean / median(Mean) measures the deviation from the center, or from 100%. The threshold mechanism is different again: 70 to 130% is blue, and everything over 130% will be red. You might want to choose this one, if you’re interested in deviations from the norm.
Want to Automate
Request a quote and book an appointment for a free consultation with our performance testing experts.
Complex tables in Grafana and the percentage of success
To calculate the column-to-column ratio using Grafana and InfluxDB, we’ll need to put in more hours, as it requires combining several sets of data. There are no joins in InfluxQL. There are some in Flux, but they use rare tools, Kapacitor or Chronograf. Those joins, that are available in Flux without Kapacitor or Chronograf, don’t work with Grafana. There is an outer join feature in Grafana 7.0, but, to cut a long story short, it lost some of the features you’ll need from earlier versions of Grafana, so we’ll need several versions.
Grafana 5.2+: Merge
Merge has been available in Grafana for quite a while, but it requires matches in tags, which is rather easy, and in time between different columns, which is more complicated to achieve. It only saves time in the first column, but time in other columns should match time for the first one for Merge to work. To make them all match, reset all time columns to zero by using this code:
SELECT
last(A) + first(A) – last(A)
FROM
(SELECT A FROM _ GROUP BY B )
WHERE $timeFilter
GROUP BY B
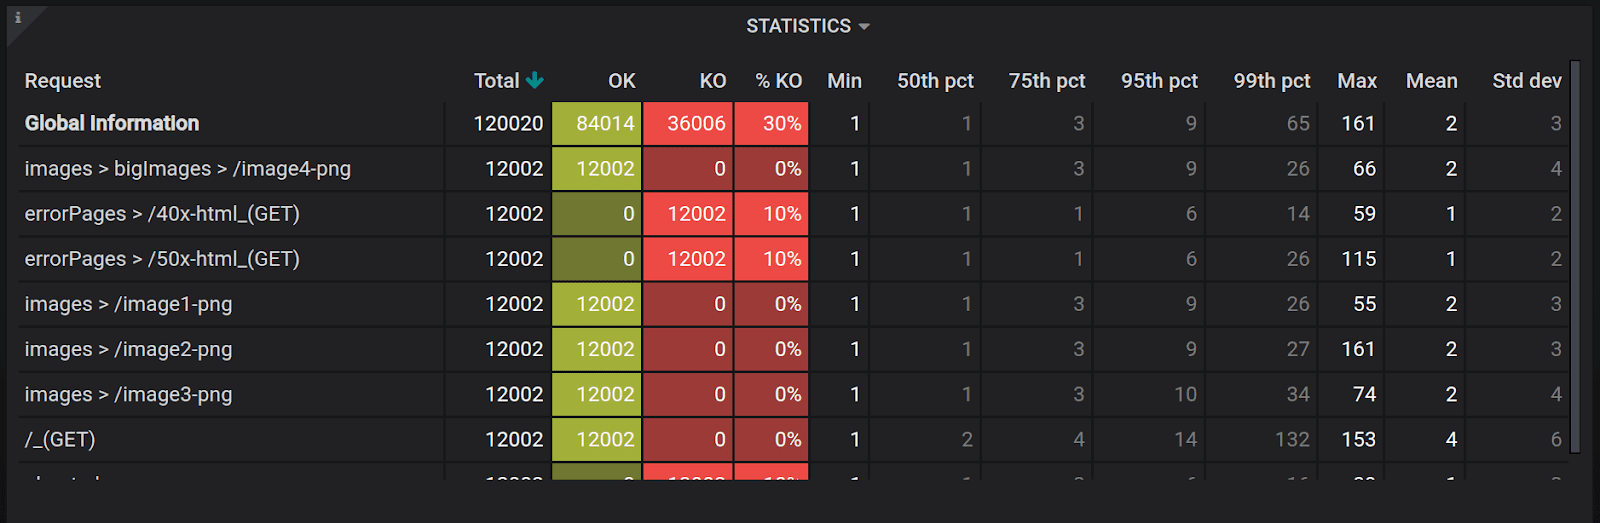
Afterwards, you’ll be able to include as many parameters as you’d like into the table and produce a visually pleasing and informative result, like this one below. Note that it includes OK, KO, %KO, different percentiles, etc.
Grafana 7.0: Outer Join
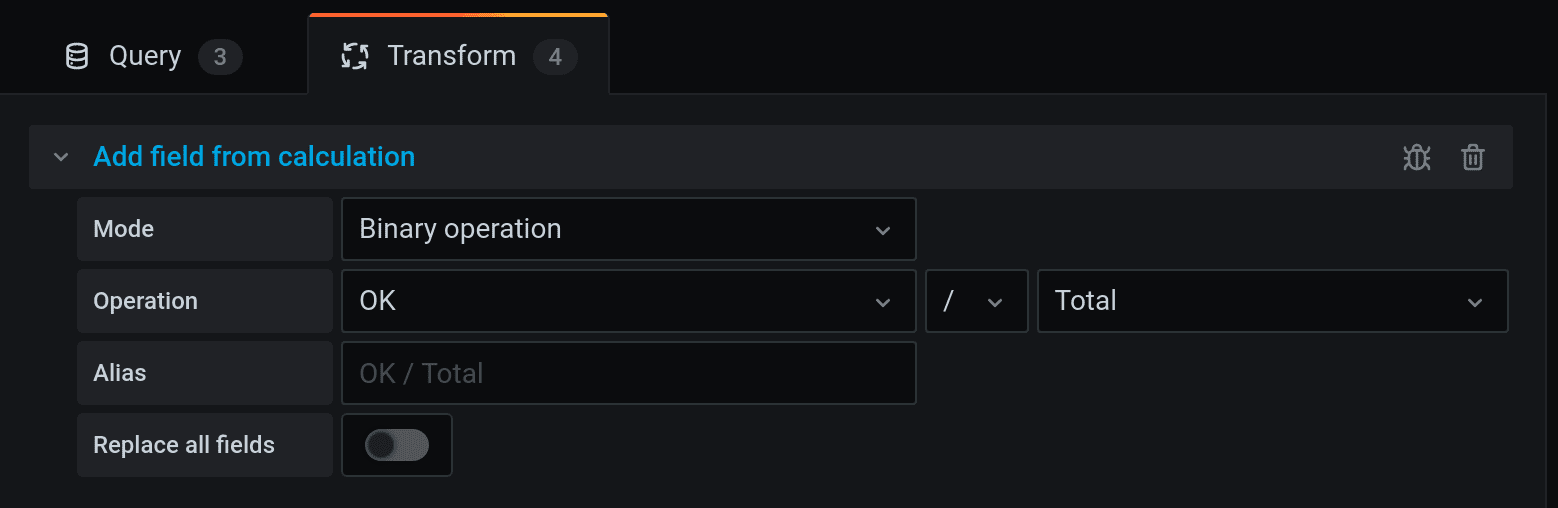
To do the same in Grafana 7.0, you’ll need to use Outer Join. For the sake of practicing, let’s try to retrieve OK, KO and Total, and group them by tag run. Each will need a different query, totalling three. Then, go to Transform tab and join them by run field.

As a result, these columns will be joined, but the columns with time will be set to current time and become useless. In fact, this is not a real Outer Join, but an upgrade to Merge, that equals time by setting all times to current. Hence, you can hide time columns using the tab Organize fields. After you have joined the columns in the same table, new operations appear in the Transform tab. For instance, you can divide the number in one column by the number from another one. This is called a binary operation.
For example, it allows you to count results for successful and failed requests. Instead of dry figures, your report will now have analytics visualised in a beautifully looking table.
That would be a perfect result: if you’re ready to sacrifice time columns with all the data, Grafana 7.0 Outer join is your choice.
Don’t Want to Run Tests by Yourself?
We have been working on performance testing projects since 2008.
Drop us a line to find out what our team can do for you.
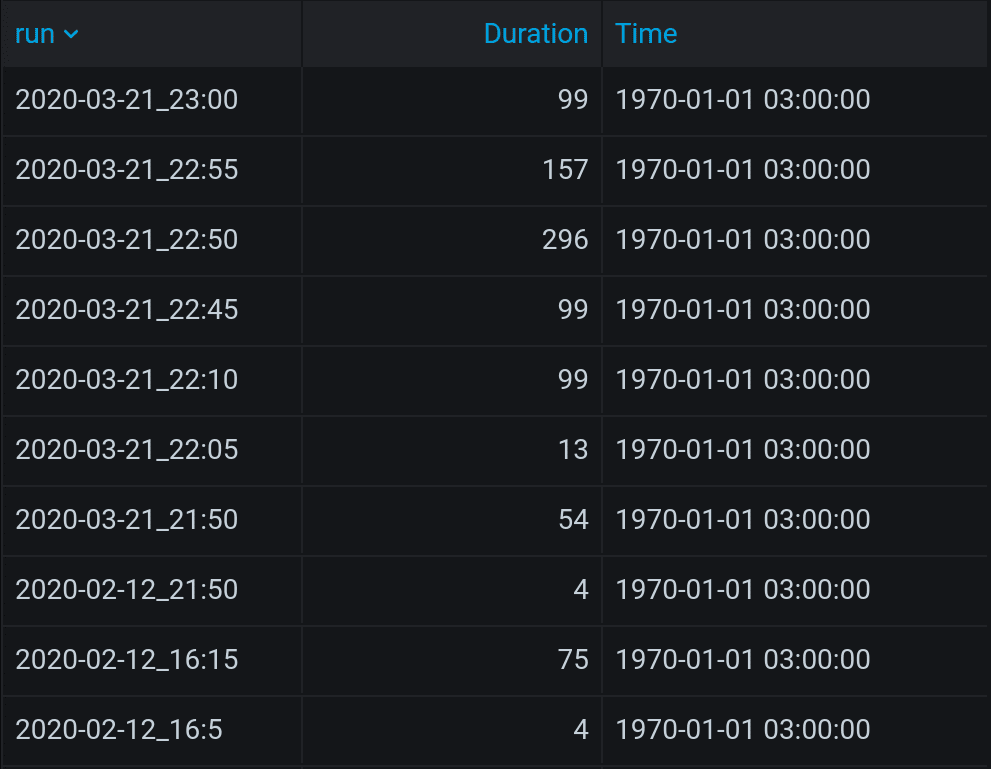
Test Duration and Time column
However, very often time is important. In your report, you need tests duration. You also need to know if the test has been interrupted and what was an average RPS. For an average duration, you will need to copy this query, since it would be impossible to build it in the Query inspector:
SELECT SUM(“e”) as “Duration” FROM
(SELECT elapsed(“count”, 1s) as “e”
FROM “$archive”.”gatling”
WHERE (“request” = ‘allRequests’ AND
“simulation” =~ /^$simulation$/ AND
“status” = ‘all’
) AND $timeFilter
GROUP BY “run”)
GROUP BY “run”
The query will bring back results with time in Unix Epoch. However, if you change SUM in the query into CUMULATTIVE_SUM, you’ll get an actual test duration.
SELECT last(“d”) AS “Duration”
FROM (
SELECT cumulative_sum(elapsed(last(“count”), 1s)) AS “d”
FROM “$archive”.”gatling”
WHERE “simulation” = ‘$simulation’ AND $timeFilter
GROUP BY time(1s), “run”
)
WHERE $timeFilter
GROUP BY “run”
These results will also be easy to validate, since there is all the data you need.
Grouping CUMULATIVE_SUM by 1s might feel like too much, so you can group by 10s. You need to know though, that this way all the tests shorter than 10s total will be disregarded and disappear. The remaining results will be rather precise.
The problem remains: as soon as you add another column, Outer join brings all values in column Time to zero, and you lose all the data. So don’t use it, if it is of value to you. But if you need only RPS, it is easy to count by dividing Total by Duration in Binary Operation mode in the Transform tab. Add it to the table, and you get all the analytics in one!
Generating a link to see test details
Perfectionists would probably like to be able to click on the test and see the details. It is possible but will require even more effort. Use Merge from Grafana 5.2+ to create links, since Merge doesn’t delete time. The code is, as follows:
/d/gatling/gatling-report?
time=${__cell}&
time.window=${__cell_2}&
var-run=${__cell_1}&
var-simulation=${simulation}&
var-loadstation=All&
…
Then, use Docker (read about its role in the developer’s environment in the first part of this article). It will let you open dashboards created in previous Grafana versions by Grafana 7.0.
#!/bin/sh -x
docker pull grafana/grafana:6.7.2
DIR=“$(pwd)“
ID=$(id -u)
docker run –name=grafana672 \
–network=test –user $ID -p 3672:3000 \
-v $DIR/grafana.ini:/etc/grafana/grafana.ini \
-v $DIR/provisioning:/etc/grafana/provisioning \
grafana/grafana:6.7.2
This way, you will be able to bypass the loss of functionality due to backward compatibility:
- run Grafana 6.7.2 in Docker;
- create a dashboard in Grafana 6.7.2;
- download the board in JSON;
- run Grafana 7.0 in Docker;
- import the dashboard into Grafana 7.0;
- modify the board without changing the old one.
Who’s the winner? You’re the winner!
Never waste time on manual reports again! If you want to automate the whole performance testing process instead of automating test reports only, request a quote and book an appointment for a free consultation with our performance testing experts. You will find out how to significantly accelerate the launch of your software product and reduce costs.
Have a Project in Mind?
We have been working on performance testing projects since 2008.
Drop us a line to find out what our team can do for you.